Bank of America 2013 Annual Report Download - page 275
Download and view the complete annual report
Please find page 275 of the 2013 Bank of America annual report below. You can navigate through the pages in the report by either clicking on the pages listed below, or by using the keyword search tool below to find specific information within the annual report.-
 1
1 -
2
-
3
-
4
-
5
-
6
-
7
-
8
-
9
-
10
-
11
-
12
-
13
-
14
-
15
-
16
-
17
-
18
-
19
-
20
-
21
-
22
-
23
-
24
-
25
-
26
-
27
-
28
-
29
-
30
-
31
-
32
-
33
-
34
-
35
-
36
-
37
-
38
-
39
-
40
-
41
-
42
-
43
-
44
-
45
-
46
-
47
-
48
-
49
-
50
-
51
-
52
-
53
-
54
-
55
-
56
-
57
-
58
-
59
-
60
-
61
-
62
-
63
-
64
-
65
-
66
-
67
-
68
-
69
-
70
-
71
-
72
-
73
-
74
-
75
-
76
-
77
-
78
-
79
-
80
-
81
-
82
-
83
-
84
-
85
-
86
-
87
-
88
-
89
-
90
-
91
-
92
-
93
-
94
-
95
-
96
-
97
-
98
-
99
-
100
-
101
-
102
-
103
-
104
-
105
-
106
-
107
-
108
-
109
-
110
-
111
-
112
-
113
-
114
-
115
-
116
-
117
-
118
-
119
-
120
-
121
-
122
-
123
-
124
-
125
-
126
-
127
-
128
-
129
-
130
-
131
-
132
-
133
-
134
-
135
-
136
-
137
-
138
-
139
-
140
-
141
-
142
-
143
-
144
-
145
-
146
-
147
-
148
-
149
-
150
-
151
-
152
-
153
-
154
-
155
-
156
-
157
-
158
-
159
-
160
-
161
-
162
-
163
-
164
-
165
-
166
-
167
-
168
-
169
-
170
-
171
-
172
-
173
-
174
-
175
-
176
-
177
-
178
-
179
-
180
-
181
-
182
-
183
-
184
-
185
-
186
-
187
-
188
-
189
-
190
-
191
-
192
-
193
-
194
-
195
-
196
-
197
-
198
-
199
-
200
-
201
-
202
-
203
-
204
-
205
-
206
-
207
-
208
-
209
-
210
-
211
-
212
-
213
-
214
-
215
-
216
-
217
-
218
-
219
-
220
-
221
-
222
-
223
-
224
-
225
-
226
-
227
-
228
-
229
-
230
-
231
-
232
-
233
-
234
-
235
-
236
-
237
-
238
-
239
-
240
-
241
-
242
-
243
-
244
-
245
-
246
-
247
-
248
-
249
-
250
-
251
-
252
-
253
-
254
-
255
-
256
-
257
-
258
-
259
-
260
-
261
-
262
-
263
-
264
-
 265
265 -
 266
266 -
 267
267 -
 268
268 -
 269
269 -
 270
270 -
 271
271 -
 272
272 -
 273
273 -
 274
274 -
 275
275 -
 276
276 -
 277
277 -
 278
278 -
 279
279 -
 280
280 -
 281
281 -
 282
282 -
 283
283 -
 284
284
 |
 |

Bank of America 2013 273
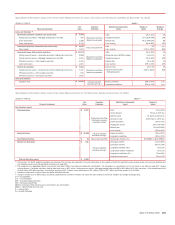
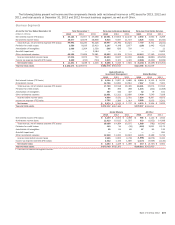
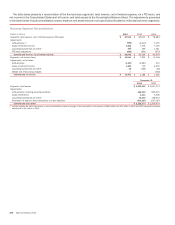
The following tables present net income and the components thereto (with net interest income on a FTE basis) for 2013, 2012 and
2011, and total assets at December 31, 2013 and 2012 for each business segment, as well as All Other.
Business Segments
At and for the Year Ended December 31 Total Corporation (1) Consumer & Business Banking Consumer Real Estate Services
(Dollars in millions) 2013 2012 2011 2013 2012 2011 2013 2012 2011
Net interest income (FTE basis) $ 43,124 $ 41,557 $ 45,588 $ 20,051 $ 19,853 $ 22,249 $ 2,890 $ 2,930 $ 3,209
Noninterest income (loss) 46,677 42,678 48,838 9,816 9,937 11,572 4,826 5,821 (6,310)
Total revenue, net of interest expense (FTE basis) 89,801 84,235 94,426 29,867 29,790 33,821 7,716 8,751 (3,101)
Provision for credit losses 3,556 8,169 13,410 3,107 4,148 3,677 (156) 1,442 4,523
Amortization of intangibles 1,086 1,264 1,509 505 626 759 ——11
Goodwill impairment —— 3,184 ——— —— 2,603
Other noninterest expense 68,128 70,829 75,581 15,852 16,369 17,153 16,013 17,190 19,055
Income (loss) before income taxes 17,031 3,973 742 10,403 8,647 12,232 (8,141)(9,881) (29,293)
Income tax expense (benefit) (FTE basis) 5,600 (215) (704) 3,815 3,101 4,431 (2,986)(3,442) (9,939)
Net income (loss) $ 11,431 $ 4,188 $ 1,446 $ 6,588 $ 5,546 $ 7,801 $(5,155)$ (6,439) $ (19,354)
Year-end total assets $ 2,102,273 $2,209,974 $ 592,978 $554,915 $ 113,386 $131,059
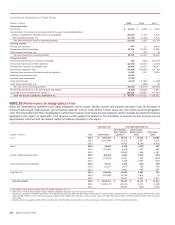
Global Wealth &
Investment Management Global Banking
2013 2012 2011 2013 2012 2011
Net interest income (FTE basis) $ 6,064 $ 5,827 $ 5,885 $ 8,914 $ 8,135 $ 8,233
Noninterest income 11,726 10,691 10,610 7,567 7,539 7,361
Total revenue, net of interest expense (FTE basis) 17,790 16,518 16,495 16,481 15,674 15,594
Provision for credit losses 56 266 398 1,075 (342) (1,308)
Amortization of intangibles 387 410 437 62 79 101
Other noninterest expense 12,651 12,311 12,899 7,490 7,540 7,928
Income before income taxes 4,696 3,531 2,761 7,854 8,397 8,873
Income tax expense (FTE basis) 1,722 1,286 1,014 2,880 3,053 3,251
Net income $ 2,974 $ 2,245 $ 1,747 $ 4,974 $ 5,344 $ 5,622
Year-end total assets $ 274,112 $297,326 $ 379,207 $331,611
Global Markets All Other
2013 2012 2011 2013 2012 2011
Net interest income (FTE basis) $ 4,239 $ 3,672 $ 4,068 $966 $ 1,140 $ 1,944
Noninterest income (loss) 11,819 10,612 11,507 923 (1,922) 14,098
Total revenue, net of interest expense (FTE basis) 16,058 14,284 15,575 1,889 (782) 16,042
Provision for credit losses 140 34 (53) (666) 2,621 6,173
Amortization of intangibles 65 64 66 67 85 135
Goodwill impairment ——— —— 581
Other noninterest expense 11,948 11,231 12,824 4,174 6,188 5,722
Income (loss) before income taxes 3,905 2,955 2,738 (1,686)(9,676) 3,431
Income tax expense (benefit) (FTE basis) 2,342 1,726 1,669 (2,173)(5,939) (1,130)
Net income (loss) $ 1,563 $ 1,229 $ 1,069 $487 $ (3,737) $ 4,561
Year-end total assets $ 575,709 $632,263 $ 166,881 $262,800
(1) There were no material intersegment revenues.