Bank of America 2013 Annual Report Download - page 25
Download and view the complete annual report
Please find page 25 of the 2013 Bank of America annual report below. You can navigate through the pages in the report by either clicking on the pages listed below, or by using the keyword search tool below to find specific information within the annual report.-
 1
1 -
2
-
3
-
4
-
5
-
6
-
7
-
8
-
9
-
10
-
11
-
12
-
13
-
14
-
 15
15 -
 16
16 -
 17
17 -
 18
18 -
 19
19 -
 20
20 -
 21
21 -
 22
22 -
 23
23 -
 24
24 -
 25
25 -
 26
26 -
 27
27 -
 28
28 -
 29
29 -
 30
30 -
 31
31 -
 32
32 -
 33
33 -
 34
34 -
 35
35 -
36
-
37
-
38
-
39
-
40
-
41
-
42
-
43
-
44
-
45
-
46
-
47
-
48
-
49
-
50
-
51
-
52
-
53
-
54
-
55
-
56
-
57
-
58
-
59
-
60
-
61
-
62
-
63
-
64
-
65
-
66
-
67
-
68
-
69
-
70
-
71
-
72
-
73
-
74
-
75
-
76
-
77
-
78
-
79
-
80
-
81
-
82
-
83
-
84
-
85
-
86
-
87
-
88
-
89
-
90
-
91
-
92
-
93
-
94
-
95
-
96
-
97
-
98
-
99
-
100
-
101
-
102
-
103
-
104
-
105
-
106
-
107
-
108
-
109
-
110
-
111
-
112
-
113
-
114
-
115
-
116
-
117
-
118
-
119
-
120
-
121
-
122
-
123
-
124
-
125
-
126
-
127
-
128
-
129
-
130
-
131
-
132
-
133
-
134
-
135
-
136
-
137
-
138
-
139
-
140
-
141
-
142
-
143
-
144
-
145
-
146
-
147
-
148
-
149
-
150
-
151
-
152
-
153
-
154
-
155
-
156
-
157
-
158
-
159
-
160
-
161
-
162
-
163
-
164
-
165
-
166
-
167
-
168
-
169
-
170
-
171
-
172
-
173
-
174
-
175
-
176
-
177
-
178
-
179
-
180
-
181
-
182
-
183
-
184
-
185
-
186
-
187
-
188
-
189
-
190
-
191
-
192
-
193
-
194
-
195
-
196
-
197
-
198
-
199
-
200
-
201
-
202
-
203
-
204
-
205
-
206
-
207
-
208
-
209
-
210
-
211
-
212
-
213
-
214
-
215
-
216
-
217
-
218
-
219
-
220
-
221
-
222
-
223
-
224
-
225
-
226
-
227
-
228
-
229
-
230
-
231
-
232
-
233
-
234
-
235
-
236
-
237
-
238
-
239
-
240
-
241
-
242
-
243
-
244
-
245
-
246
-
247
-
248
-
249
-
250
-
251
-
252
-
253
-
254
-
255
-
256
-
257
-
258
-
259
-
260
-
261
-
262
-
263
-
264
-
265
-
266
-
267
-
268
-
269
-
270
-
271
-
272
-
273
-
274
-
275
-
276
-
277
-
278
-
279
-
280
-
281
-
282
-
283
-
284
 |
 |

Bank of America 2013 23
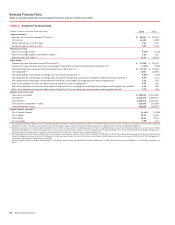
Financial Highlights
Net income was $11.4 billion, or $0.90 per diluted share in 2013
compared to $4.2 billion, or $0.25 per diluted share in 2012. The
results for 2013 reflect our efforts to stabilize revenue, decrease
costs, strengthen the balance sheet and improve credit quality.
Table 2 Summary Income Statement
(Dollars in millions) 2013 2012
Net interest income (FTE basis) (1) $ 43,124 $ 41,557
Noninterest income 46,677 42,678
Total revenue, net of interest expense (FTE basis) (1) 89,801 84,235
Provision for credit losses 3,556 8,169
Noninterest expense 69,214 72,093
Income before income taxes 17,031 3,973
Income tax expense (benefit) (FTE basis) (1) 5,600 (215)
Net income 11,431 4,188
Preferred stock dividends 1,349 1,428
Net income applicable to common shareholders $ 10,082 $ 2,760
Per common share information
Earnings $0.94
$0.26
Diluted earnings 0.90 0.25
(1) FTE basis is a non-GAAP financial measure. For more information on this measure, see
Supplemental Financial Data on page 29, and for a corresponding reconciliation to GAAP financial
measures, see Statistical Table XV.
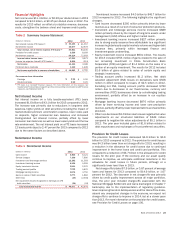
Net Interest Income
Net interest income on a fully taxable-equivalent (FTE) basis
increased $1.6 billion to $43.1 billion for 2013 compared to 2012.
The increase was primarily due to reductions in long-term debt
balances, higher yields on debt securities including the impact of
market-related premium amortization expense, lower rates paid
on deposits, higher commercial loan balances and increased
trading-related net interest income, partially offset by lower
consumer loan balances as well as lower asset yields and the low
rate environment. The net interest yield on a FTE basis increased
12 basis points (bps) to 2.47 percent for 2013 compared to 2012
due to the same factors as described above.
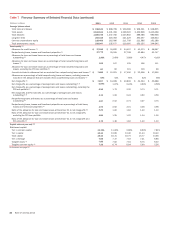
Noninterest Income
Table 3 Noninterest Income
(Dollars in millions) 2013 2012
Card income $ 5,826 $ 6,121
Service charges 7,390 7,600
Investment and brokerage services 12,282 11,393
Investment banking income 6,126 5,299
Equity investment income 2,901 2,070
Trading account profits 7,056 5,870
Mortgage banking income 3,874 4,750
Gains on sales of debt securities 1,271 1,662
Other loss (29) (2,034)
Net impairment losses recognized in earnings on AFS
debt securities (20) (53)
Total noninterest income $ 46,677 $ 42,678
Noninterest income increased $4.0 billion to $46.7 billion for
2013 compared to 2012. The following highlights the significant
changes.
Card income decreased $295 million primarily driven by lower
revenue as a result of our exit of consumer protection products.
Investment and brokerage services income increased $889
million primarily driven by the impact of long-term assets under
management (AUM) inflows and higher market levels.
Investment banking income increased $827 million primarily
due to strong equity issuance fees attributable to a significant
increase in global equity capital markets volume and higher debt
issuance fees, primarily within leveraged finance and
investment-grade underwriting.
Equity investment income increased $831 million. The results
for 2013 included $753 million of gains related to the sale of
our remaining investment in China Construction Bank
Corporation (CCB) and gains of $1.4 billion on the sales of a
portion of an equity investment. The results for 2012 included
$1.6 billion of gains related to sales of certain equity and
strategic investments.
Trading account profits increased $1.2 billion. Net debit
valuation adjustment (DVA) losses on derivatives were $508
million in 2013 compared to losses of $2.5 billion in 2012.
Excluding net DVA, trading account profits decreased $783
million due to decreases in our fixed-income, currency and
commodities (FICC) businesses driven by a challenging trading
environment, partially offset by an increase in our equities
businesses.
Mortgage banking income decreased $876 million primarily
driven by lower servicing income and lower core production
revenue, partially offset by lower representations and warranties
provision.
Other loss decreased $2.0 billion due to lower negative fair value
adjustments on our structured liabilities of $649 million
compared to negative fair value adjustments of $5.1 billion in
2012. The prior year included gains of $1.6 billion related to
debt repurchases and exchanges of trust preferred securities.
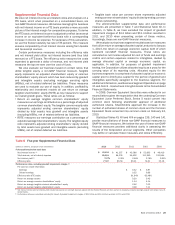
Provision for Credit Losses
The provision for credit losses decreased $4.6 billion to $3.6
billion for 2013 compared to 2012. The provision for credit losses
was $4.3 billion lower than net charge-offs for 2013, resulting in
a reduction in the allowance for credit losses due to continued
improvement in the home loans and credit card portfolios. This
compared to a reduction of $6.7 billion in the allowance for credit
losses for the prior year. If the economy and our asset quality
continue to improve, we anticipate additional reductions in the
allowance for credit losses in future periods, although at a
significantly lower level than in 2013.
Net charge-offs totaled $7.9 billion, or 0.87 percent of average
loans and leases for 2013 compared to $14.9 billion, or 1.67
percent for 2012. The decrease in net charge-offs was primarily
driven by credit quality improvement across all major portfolios.
Also, the prior year included charge-offs associated with the
National Mortgage Settlement and loans discharged in Chapter 7
bankruptcy due to the implementation of regulatory guidance.
Given improving trends in delinquencies and the Home Price Index,
absent any unexpected changes in the economy, we expect net
charge-offs to continue to improve in 2014, but at a slower pace
than 2013. For more information on the provision for credit losses,
see Provision for Credit Losses on page 100.