Bank of America 2013 Annual Report Download - page 125
Download and view the complete annual report
Please find page 125 of the 2013 Bank of America annual report below. You can navigate through the pages in the report by either clicking on the pages listed below, or by using the keyword search tool below to find specific information within the annual report.-
 1
1 -
2
-
3
-
4
-
5
-
6
-
7
-
8
-
9
-
10
-
11
-
12
-
13
-
14
-
15
-
16
-
17
-
18
-
19
-
20
-
21
-
22
-
23
-
24
-
25
-
26
-
27
-
28
-
29
-
30
-
31
-
32
-
33
-
34
-
35
-
36
-
37
-
38
-
39
-
40
-
41
-
42
-
43
-
44
-
45
-
46
-
47
-
48
-
49
-
50
-
51
-
52
-
53
-
54
-
55
-
56
-
57
-
58
-
59
-
60
-
61
-
62
-
63
-
64
-
65
-
66
-
67
-
68
-
69
-
70
-
71
-
72
-
73
-
74
-
75
-
76
-
77
-
78
-
79
-
80
-
81
-
82
-
83
-
84
-
85
-
86
-
87
-
88
-
89
-
90
-
91
-
92
-
93
-
94
-
95
-
96
-
97
-
98
-
99
-
100
-
101
-
102
-
103
-
104
-
105
-
106
-
107
-
108
-
109
-
110
-
111
-
112
-
113
-
114
-
 115
115 -
 116
116 -
 117
117 -
 118
118 -
 119
119 -
 120
120 -
 121
121 -
 122
122 -
 123
123 -
 124
124 -
 125
125 -
 126
126 -
 127
127 -
 128
128 -
 129
129 -
 130
130 -
 131
131 -
 132
132 -
 133
133 -
 134
134 -
 135
135 -
136
-
137
-
138
-
139
-
140
-
141
-
142
-
143
-
144
-
145
-
146
-
147
-
148
-
149
-
150
-
151
-
152
-
153
-
154
-
155
-
156
-
157
-
158
-
159
-
160
-
161
-
162
-
163
-
164
-
165
-
166
-
167
-
168
-
169
-
170
-
171
-
172
-
173
-
174
-
175
-
176
-
177
-
178
-
179
-
180
-
181
-
182
-
183
-
184
-
185
-
186
-
187
-
188
-
189
-
190
-
191
-
192
-
193
-
194
-
195
-
196
-
197
-
198
-
199
-
200
-
201
-
202
-
203
-
204
-
205
-
206
-
207
-
208
-
209
-
210
-
211
-
212
-
213
-
214
-
215
-
216
-
217
-
218
-
219
-
220
-
221
-
222
-
223
-
224
-
225
-
226
-
227
-
228
-
229
-
230
-
231
-
232
-
233
-
234
-
235
-
236
-
237
-
238
-
239
-
240
-
241
-
242
-
243
-
244
-
245
-
246
-
247
-
248
-
249
-
250
-
251
-
252
-
253
-
254
-
255
-
256
-
257
-
258
-
259
-
260
-
261
-
262
-
263
-
264
-
265
-
266
-
267
-
268
-
269
-
270
-
271
-
272
-
273
-
274
-
275
-
276
-
277
-
278
-
279
-
280
-
281
-
282
-
283
-
284
 |
 |

Bank of America 2013 123
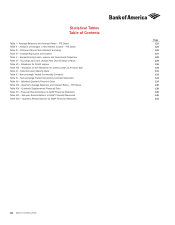
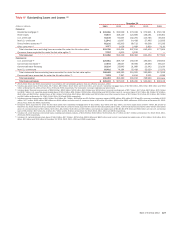
Table I Average Balances and Interest Rates – FTE Basis
2013 2012 2011
(Dollars in millions)
Average
Balance
Interest
Income/
Expense
Yield/
Rate
Average
Balance
Interest
Income/
Expense
Yield/
Rate
Average
Balance
Interest
Income/
Expense
Yield/
Rate
Earning assets
Time deposits placed and other short-term investments (1) $ 16,066 $ 187 1.16% $ 22,888 $ 237 1.03% $ 28,242 $366 1.29%
Federal funds sold and securities borrowed or purchased under
agreements to resell 224,331 1,229 0.55 236,042 1,502 0.64 245,069 2,147 0.88
Trading account assets 168,998 4,879 2.89 170,647 5,306 3.11 181,996 6,142 3.37
Debt securities (2) 337,953 9,779 2.89 353,577 8,931 2.53 342,650 9,606 2.80
Loans and leases (3):
Residential mortgage (4) 256,531 9,319 3.63 264,164 9,845 3.73 280,112 11,588 4.14
Home equity 100,267 3,831 3.82 117,339 4,426 3.77 130,945 5,050 3.86
U.S. credit card 90,369 8,792 9.73 94,863 9,504 10.02 105,478 10,808 10.25
Non-U.S. credit card 10,861 1,271 11.70 13,549 1,572 11.60 24,049 2,656 11.04
Direct/Indirect consumer (5) 82,907 2,370 2.86 84,424 2,900 3.44 90,163 3,716 4.12
Other consumer (6) 1,805 72 4.02 2,359 140 5.95 2,760 176 6.39
Total consumer 542,740 25,655 4.73 576,698 28,387 4.92 633,507 33,994 5.37
U.S. commercial 218,875 6,811 3.11 201,352 6,979 3.47 192,524 7,360 3.82
Commercial real estate (7) 42,346 1,392 3.29 37,982 1,332 3.51 44,406 1,522 3.43
Commercial lease financing 23,865 851 3.56 21,879 874 4.00 21,383 1,001 4.68
Non-U.S. commercial 90,815 2,082 2.29 60,857 1,594 2.62 46,276 1,382 2.99
Total commercial 375,901 11,136 2.96 322,070 10,779 3.35 304,589 11,265 3.70
Total loans and leases 918,641 36,791 4.00 898,768 39,166 4.36 938,096 45,259 4.82
Other earning assets 80,985 2,832 3.50 88,047 2,970 3.36 98,606 3,502 3.55
Total earning assets (8) 1,746,974 55,697 3.19 1,769,969 58,112 3.28 1,834,659 67,022 3.65
Cash and cash equivalents (1) 109,014 182 115,739 189 112,616 186
Other assets, less allowance for loan and lease losses 307,525
305,648 349,047
Total assets $ 2,163,513 $2,191,356 $ 2,296,322
Interest-bearing liabilities
U.S. interest-bearing deposits:
Savings $ 43,868 $ 22 0.05% $ 41,453 $ 45 0.11% $ 40,364 $100 0.25%
NOW and money market deposit accounts 506,082 413 0.08 466,096 693 0.15 470,519 1,060 0.23
Consumer CDs and IRAs 82,963 481 0.58 95,559 693 0.73 110,922 1,045 0.94
Negotiable CDs, public funds and other deposits 23,504 106 0.45 20,928 128 0.61 17,227 120 0.70
Total U.S. interest-bearing deposits 656,417 1,022 0.16 624,036 1,559 0.25 639,032 2,325 0.36
Non-U.S. interest-bearing deposits:
Banks located in non-U.S. countries 12,419 70 0.56 14,737 94 0.64 20,782 138 0.66
Governments and official institutions 1,032 2 0.24 1,019 4 0.35 1,985 7 0.35
Time, savings and other 56,193 302 0.54 53,318 333 0.63 61,632 532 0.86
Total non-U.S. interest-bearing deposits 69,644 374 0.54 69,074 431 0.62 84,399 677 0.80
Total interest-bearing deposits 726,061 1,396 0.19 693,110 1,990 0.29 723,431 3,002 0.42
Federal funds purchased, securities loaned or sold under
agreements to repurchase and short-term borrowings 301,417 2,923 0.97 318,400 3,572 1.12 324,269 4,599 1.42
Trading account liabilities 88,323 1,638 1.85 78,554 1,763 2.24 84,689 2,212 2.61
Long-term debt 263,416 6,798 2.58 316,393 9,419 2.98 421,229 11,807 2.80
Total interest-bearing liabilities (8) 1,379,217 12,755 0.92 1,406,457 16,744 1.19 1,553,618 21,620 1.39
Noninterest-bearing sources:
Noninterest-bearing deposits 363,674
354,672 312,371
Other liabilities 186,675
194,550 201,238
Shareholders’ equity 233,947
235,677 229,095
Total liabilities and shareholders’ equity $ 2,163,513 $ 2,191,356 $ 2,296,322
Net interest spread 2.27% 2.09% 2.26%
Impact of noninterest-bearing sources 0.19 0.25 0.21
Net interest income/yield on earning assets (1) $ 42,942 2.46% $ 41,368 2.34% $ 45,402 2.47%
(1) For this presentation, fees earned on overnight deposits placed with the Federal Reserve are included in the cash and cash equivalents line, consistent with the Consolidated Balance Sheet
presentation of these deposits. In addition, beginning in the third quarter of 2012, fees earned on deposits, primarily overnight, placed with certain non-U.S. central banks, which are included in the
time deposits placed and other short-term investments line in prior periods, are included in the cash and cash equivalents line. Net interest income and net interest yield are calculated excluding
the fees included in the cash and cash equivalents line.
(2) Yields on debt securities carried at fair value are calculated based on fair value rather than the cost basis. The use of fair value does not have a material impact on net interest yield.
(3) Nonperforming loans are included in the respective average loan balances. Income on these nonperforming loans is generally recognized on a cost recovery basis. PCI loans were recorded at fair
value upon acquisition and accrete interest income over the remaining life of the loan.
(4) Includes non-U.S. residential mortgage loans of $79 million, $90 million and $91 million in 2013, 2012 and 2011, respectively.
(5) Includes non-U.S. consumer loans of $6.7 billion, $7.8 billion and $8.5 billion in 2013, 2012 and 2011, respectively.
(6) Includes consumer finance loans of $1.3 billion, $1.5 billion and $1.8 billion; consumer leases of $351 million, $0 and $0; other non-U.S. consumer loans of $5 million, $699 million and $878
million; and consumer overdrafts of $153 million, $128 million and $93 million in 2013, 2012 and 2011, respectively.
(7) Includes U.S. commercial real estate loans of $40.7 billion, $36.4 billion and $42.1 billion, and non-U.S. commercial real estate loans of $1.6 billion, $1.6 billion and $2.3 billion in 2013, 2012
and 2011, respectively.
(8) Interest income includes the impact of interest rate risk management contracts, which decreased interest income on the underlying assets by $205 million, $754 million and $2.6 billion in 2013,
2012 and 2011, respectively. Interest expense includes the impact of interest rate risk management contracts, which decreased interest expense on the underlying liabilities by $2.4 billion, $2.3
billion and $2.6 billion in 2013, 2012 and 2011, respectively. For more information on interest rate contracts, see Interest Rate Risk Management for Nontrading Activities on page 109.