Bank of America 2013 Annual Report Download - page 171
Download and view the complete annual report
Please find page 171 of the 2013 Bank of America annual report below. You can navigate through the pages in the report by either clicking on the pages listed below, or by using the keyword search tool below to find specific information within the annual report.-
 1
1 -
2
-
3
-
4
-
5
-
6
-
7
-
8
-
9
-
10
-
11
-
12
-
13
-
14
-
15
-
16
-
17
-
18
-
19
-
20
-
21
-
22
-
23
-
24
-
25
-
26
-
27
-
28
-
29
-
30
-
31
-
32
-
33
-
34
-
35
-
36
-
37
-
38
-
39
-
40
-
41
-
42
-
43
-
44
-
45
-
46
-
47
-
48
-
49
-
50
-
51
-
52
-
53
-
54
-
55
-
56
-
57
-
58
-
59
-
60
-
61
-
62
-
63
-
64
-
65
-
66
-
67
-
68
-
69
-
70
-
71
-
72
-
73
-
74
-
75
-
76
-
77
-
78
-
79
-
80
-
81
-
82
-
83
-
84
-
85
-
86
-
87
-
88
-
89
-
90
-
91
-
92
-
93
-
94
-
95
-
96
-
97
-
98
-
99
-
100
-
101
-
102
-
103
-
104
-
105
-
106
-
107
-
108
-
109
-
110
-
111
-
112
-
113
-
114
-
115
-
116
-
117
-
118
-
119
-
120
-
121
-
122
-
123
-
124
-
125
-
126
-
127
-
128
-
129
-
130
-
131
-
132
-
133
-
134
-
135
-
136
-
137
-
138
-
139
-
140
-
141
-
142
-
143
-
144
-
145
-
146
-
147
-
148
-
149
-
150
-
151
-
152
-
153
-
154
-
155
-
156
-
157
-
158
-
159
-
160
-
 161
161 -
 162
162 -
 163
163 -
 164
164 -
 165
165 -
 166
166 -
 167
167 -
 168
168 -
 169
169 -
 170
170 -
 171
171 -
 172
172 -
 173
173 -
 174
174 -
 175
175 -
 176
176 -
 177
177 -
 178
178 -
 179
179 -
 180
180 -
 181
181 -
182
-
183
-
184
-
185
-
186
-
187
-
188
-
189
-
190
-
191
-
192
-
193
-
194
-
195
-
196
-
197
-
198
-
199
-
200
-
201
-
202
-
203
-
204
-
205
-
206
-
207
-
208
-
209
-
210
-
211
-
212
-
213
-
214
-
215
-
216
-
217
-
218
-
219
-
220
-
221
-
222
-
223
-
224
-
225
-
226
-
227
-
228
-
229
-
230
-
231
-
232
-
233
-
234
-
235
-
236
-
237
-
238
-
239
-
240
-
241
-
242
-
243
-
244
-
245
-
246
-
247
-
248
-
249
-
250
-
251
-
252
-
253
-
254
-
255
-
256
-
257
-
258
-
259
-
260
-
261
-
262
-
263
-
264
-
265
-
266
-
267
-
268
-
269
-
270
-
271
-
272
-
273
-
274
-
275
-
276
-
277
-
278
-
279
-
280
-
281
-
282
-
283
-
284
 |
 |

Bank of America 2013 169
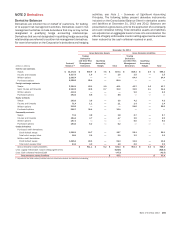
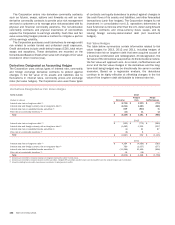
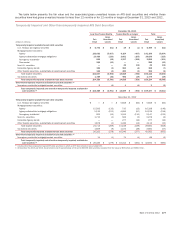
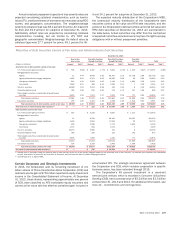
Cash Flow and Net Investment Hedges
The table below summarizes certain information related to cash
flow hedges and net investment hedges for 2013, 2012 and 2011.
During the next 12 months, net losses in accumulated other
comprehensive income (OCI) of $784 million ($494 million after-
tax) on derivative instruments that qualify as cash flow hedges are
expected to be reclassified into earnings. These net losses
reclassified into earnings are expected to primarily reduce net
interest income related to the respective hedged items. Amounts
related to commodity price risk reclassified from accumulated OCI
are recorded in trading account profits with the underlying hedged
item. Amounts related to price risk on restricted stock awards
reclassified from accumulated OCI are recorded in personnel
expense.
Amounts related to foreign exchange risk recognized in
accumulated OCI on derivatives exclude pre-tax losses of $7
million and pre-tax gains of $82 million related to long-term debt
designated as a net investment hedge for 2012 and 2011. There
were no such hedges for 2013.
Derivatives Designated as Cash Flow and Net Investment Hedges
2013
(Dollars in millions, amounts pre-tax)
Gains (Losses)
Recognized in
Accumulated OCI
on Derivatives
Gains (Losses)
in Income
Reclassified from
Accumulated OCI
Hedge
Ineffectiveness and
Amounts Excluded
from Effectiveness
Testing (1)
Cash flow hedges
Interest rate risk on variable-rate portfolios $ (321) $ (1,102)$ —
Price risk on restricted stock awards 477 329 —
Total $156 $(773)$ —
Net investment hedges
Foreign exchange risk $ 1,024 $ (355) $ (134)
2012
Cash flow hedges
Interest rate risk on variable-rate portfolios $ 10 $ (957) $ —
Price risk on restricted stock awards 420 (78) —
Total $ 430 $ (1,035) $ —
Net investment hedges
Foreign exchange risk $ (771) $ (26) $ (269)
2011
Cash flow hedges
Interest rate risk on variable-rate portfolios $ (2,079) $ (1,392) $ (8)
Commodity price risk on forecasted purchases and sales (3) 6 (3)
Price risk on restricted stock awards (408) (231) —
Total $ (2,490) $ (1,617) $ (11)
Net investment hedges
Foreign exchange risk $ (1,055) $ 384 $ (572)
(1) Amounts related to derivatives designated as cash flow hedges represent hedge ineffectiveness and amounts related to net investment hedges represent amounts excluded from effectiveness
testing.