Bank of America 2013 Annual Report Download - page 84
Download and view the complete annual report
Please find page 84 of the 2013 Bank of America annual report below. You can navigate through the pages in the report by either clicking on the pages listed below, or by using the keyword search tool below to find specific information within the annual report.-
 1
1 -
2
-
3
-
4
-
5
-
6
-
7
-
8
-
9
-
10
-
11
-
12
-
13
-
14
-
15
-
16
-
17
-
18
-
19
-
20
-
21
-
22
-
23
-
24
-
25
-
26
-
27
-
28
-
29
-
30
-
31
-
32
-
33
-
34
-
35
-
36
-
37
-
38
-
39
-
40
-
41
-
42
-
43
-
44
-
45
-
46
-
47
-
48
-
49
-
50
-
51
-
52
-
53
-
54
-
55
-
56
-
57
-
58
-
59
-
60
-
61
-
62
-
63
-
64
-
65
-
66
-
67
-
68
-
69
-
70
-
71
-
72
-
73
-
 74
74 -
 75
75 -
 76
76 -
 77
77 -
 78
78 -
 79
79 -
 80
80 -
 81
81 -
 82
82 -
 83
83 -
 84
84 -
 85
85 -
 86
86 -
 87
87 -
 88
88 -
 89
89 -
 90
90 -
 91
91 -
 92
92 -
 93
93 -
 94
94 -
95
-
96
-
97
-
98
-
99
-
100
-
101
-
102
-
103
-
104
-
105
-
106
-
107
-
108
-
109
-
110
-
111
-
112
-
113
-
114
-
115
-
116
-
117
-
118
-
119
-
120
-
121
-
122
-
123
-
124
-
125
-
126
-
127
-
128
-
129
-
130
-
131
-
132
-
133
-
134
-
135
-
136
-
137
-
138
-
139
-
140
-
141
-
142
-
143
-
144
-
145
-
146
-
147
-
148
-
149
-
150
-
151
-
152
-
153
-
154
-
155
-
156
-
157
-
158
-
159
-
160
-
161
-
162
-
163
-
164
-
165
-
166
-
167
-
168
-
169
-
170
-
171
-
172
-
173
-
174
-
175
-
176
-
177
-
178
-
179
-
180
-
181
-
182
-
183
-
184
-
185
-
186
-
187
-
188
-
189
-
190
-
191
-
192
-
193
-
194
-
195
-
196
-
197
-
198
-
199
-
200
-
201
-
202
-
203
-
204
-
205
-
206
-
207
-
208
-
209
-
210
-
211
-
212
-
213
-
214
-
215
-
216
-
217
-
218
-
219
-
220
-
221
-
222
-
223
-
224
-
225
-
226
-
227
-
228
-
229
-
230
-
231
-
232
-
233
-
234
-
235
-
236
-
237
-
238
-
239
-
240
-
241
-
242
-
243
-
244
-
245
-
246
-
247
-
248
-
249
-
250
-
251
-
252
-
253
-
254
-
255
-
256
-
257
-
258
-
259
-
260
-
261
-
262
-
263
-
264
-
265
-
266
-
267
-
268
-
269
-
270
-
271
-
272
-
273
-
274
-
275
-
276
-
277
-
278
-
279
-
280
-
281
-
282
-
283
-
284
 |
 |

82 Bank of America 2013
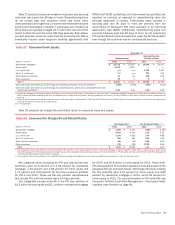
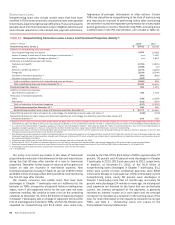
Table 34 presents the unpaid principal balance, carrying value, related valuation allowance and the net carrying value as a percentage
of the unpaid principal balance for the PCI loan portfolio.
Table 34 Purchased Credit-impaired Loan Portfolio
December 31, 2013
(Dollars in millions)
Unpaid
Principal
Balance
Carrying
Value
Related
Valuation
Allowance
Carrying
Value Net of
Valuation
Allowance
Percent of
Unpaid
Principal
Balance
Residential mortgage $ 19,558 $ 18,672 $ 1,446 $ 17,226 88.08%
Home equity 6,523 6,593 1,047 5,546 85.02
Total purchased credit-impaired loan portfolio $ 26,081 $ 25,265 $ 2,493 $ 22,772 87.31
December 31, 2012
Residential mortgage $ 18,069 $ 17,451 $ 3,108 $ 14,343 79.38%
Home equity 8,434 8,667 2,428 6,239 73.97
Total purchased credit-impaired loan portfolio $ 26,503 $ 26,118 $ 5,536 $ 20,582 77.66
The total PCI unpaid principal balance decreased $422 million,
or two percent, in 2013 primarily driven by liquidations, including
sales, payoffs, paydowns and write-offs, partially offset by the $5.3
billion of loans repurchased in connection with the FNMA
Settlement.
Of the unpaid principal balance of $26.1 billion at
December 31, 2013, $4.7 billion was 180 days or more past due,
including $4.6 billion of first-lien mortgages and $91 million of
home equity loans. Of the $21.4 billion that was less than 180
days past due, $18.4 billion, or 86 percent of the total unpaid
principal balance was current based on the contractual terms while
$2.0 billion, or nine percent, was in early stage delinquency.
During 2013, we recorded a provision benefit of $707 million
for the PCI loan portfolio including a provision benefit of $552
million for residential mortgage and a provision benefit of $155
million for home equity. This compared to a provision benefit of
$103 million in 2012. The provision benefit in 2013 was primarily
driven by an improvement in our home price outlook.
The PCI valuation allowance declined $3.0 billion during 2013
due to write-offs in the PCI loan portfolio of $1.2 billion in home
equity and $1.1 billion in residential mortgage, and a provision
benefit of $707 million for the PCI loan portfolio. Write-offs during
2013 included certain home equity PCI loans that were ineligible
for the National Mortgage Settlement, but had similar
characteristics as the eligible loans and the expectation of future
cash proceeds was considered remote.
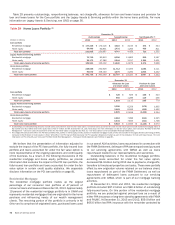
Purchased Credit-impaired Residential Mortgage Loan
Portfolio
The PCI residential mortgage loan portfolio represented 74 percent
of the total PCI loan portfolio at December 31, 2013. Those loans
to borrowers with a refreshed FICO score below 620 represented
52 percent of the PCI residential mortgage loan portfolio at
December 31, 2013. Loans with a refreshed LTV greater than
90 percent, after consideration of purchase accounting
adjustments and the related valuation allowance, represented 39
percent of the PCI residential mortgage loan portfolio and 51
percent based on the unpaid principal balance at December 31,
2013. Table 35 presents outstandings net of purchase accounting
adjustments and before the related valuation allowance, by certain
state concentrations.
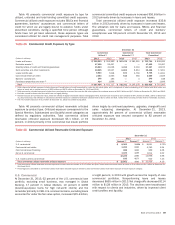
Table 35 Outstanding Purchased Credit-impaired Loan
Portfolio – Residential Mortgage State
Concentrations
December 31
(Dollars in millions) 2013 2012
California $ 8,180 $ 9,238
Florida (1) 1,750 1,797
Virginia 760 715
Maryland 728 417
Texas 433 192
Other U.S./Non-U.S. 6,821 5,092
Total $ 18,672 $ 17,451
(1) In this state, foreclosure requires a court order following a legal proceeding (judicial state).
Pay option adjustable-rate mortgages (ARMs), which are
included in the PCI residential mortgage portfolio, have interest
rates that adjust monthly and minimum required payments that
adjust annually, subject to resetting if minimum payments are
made and deferred interest limits are reached. Annual payment
adjustments are subject to a 7.5 percent maximum change. To
ensure that contractual loan payments are adequate to repay a
loan, the fully-amortizing loan payment amount is re-established
after the initial five- or ten-year period and again every five years
thereafter. These payment adjustments are not subject to the 7.5
percent limit and may be substantial due to changes in interest
rates and the addition of unpaid interest to the loan balance.
Payment advantage ARMs have interest rates that are fixed for an
initial period of five years. Payments are subject to reset if the
minimum payments are made and deferred interest limits are
reached. If interest deferrals cause a loan’s principal balance to
reach a certain level within the first 10 years of the life of the loan,
the payment is reset to the interest-only payment; then at the 10-
year point, the fully-amortizing payment is required.
The difference between the frequency of changes in a loan’s
interest rates and payments along with a limitation on changes in
the minimum monthly payments of 7.5 percent per year can result
in payments that are not sufficient to pay all of the monthly interest
charges (i.e., negative amortization). Unpaid interest is added to
the loan balance until the loan balance increases to a specified
limit, which can be no more than 115 percent of the original loan
amount, at which time a new monthly payment amount adequate
to repay the loan over its remaining contractual life is established.