Bank of America 2013 Annual Report Download - page 181
Download and view the complete annual report
Please find page 181 of the 2013 Bank of America annual report below. You can navigate through the pages in the report by either clicking on the pages listed below, or by using the keyword search tool below to find specific information within the annual report.-
 1
1 -
2
-
3
-
4
-
5
-
6
-
7
-
8
-
9
-
10
-
11
-
12
-
13
-
14
-
15
-
16
-
17
-
18
-
19
-
20
-
21
-
22
-
23
-
24
-
25
-
26
-
27
-
28
-
29
-
30
-
31
-
32
-
33
-
34
-
35
-
36
-
37
-
38
-
39
-
40
-
41
-
42
-
43
-
44
-
45
-
46
-
47
-
48
-
49
-
50
-
51
-
52
-
53
-
54
-
55
-
56
-
57
-
58
-
59
-
60
-
61
-
62
-
63
-
64
-
65
-
66
-
67
-
68
-
69
-
70
-
71
-
72
-
73
-
74
-
75
-
76
-
77
-
78
-
79
-
80
-
81
-
82
-
83
-
84
-
85
-
86
-
87
-
88
-
89
-
90
-
91
-
92
-
93
-
94
-
95
-
96
-
97
-
98
-
99
-
100
-
101
-
102
-
103
-
104
-
105
-
106
-
107
-
108
-
109
-
110
-
111
-
112
-
113
-
114
-
115
-
116
-
117
-
118
-
119
-
120
-
121
-
122
-
123
-
124
-
125
-
126
-
127
-
128
-
129
-
130
-
131
-
132
-
133
-
134
-
135
-
136
-
137
-
138
-
139
-
140
-
141
-
142
-
143
-
144
-
145
-
146
-
147
-
148
-
149
-
150
-
151
-
152
-
153
-
154
-
155
-
156
-
157
-
158
-
159
-
160
-
161
-
162
-
163
-
164
-
165
-
166
-
167
-
168
-
169
-
170
-
 171
171 -
 172
172 -
 173
173 -
 174
174 -
 175
175 -
 176
176 -
 177
177 -
 178
178 -
 179
179 -
 180
180 -
 181
181 -
 182
182 -
 183
183 -
 184
184 -
 185
185 -
 186
186 -
 187
187 -
 188
188 -
 189
189 -
 190
190 -
 191
191 -
192
-
193
-
194
-
195
-
196
-
197
-
198
-
199
-
200
-
201
-
202
-
203
-
204
-
205
-
206
-
207
-
208
-
209
-
210
-
211
-
212
-
213
-
214
-
215
-
216
-
217
-
218
-
219
-
220
-
221
-
222
-
223
-
224
-
225
-
226
-
227
-
228
-
229
-
230
-
231
-
232
-
233
-
234
-
235
-
236
-
237
-
238
-
239
-
240
-
241
-
242
-
243
-
244
-
245
-
246
-
247
-
248
-
249
-
250
-
251
-
252
-
253
-
254
-
255
-
256
-
257
-
258
-
259
-
260
-
261
-
262
-
263
-
264
-
265
-
266
-
267
-
268
-
269
-
270
-
271
-
272
-
273
-
274
-
275
-
276
-
277
-
278
-
279
-
280
-
281
-
282
-
283
-
284
 |
 |

Bank of America 2013 179
Annual constant prepayment speed and loss severity rates are
projected considering collateral characteristics such as loan-to-
value (LTV), creditworthiness of borrowers as measured using FICO
scores, and geographic concentrations. The weighted-average
severity by collateral type was 38.1 percent for prime, 42.0 percent
for Alt-A and 49.9 percent for subprime at December 31, 2013.
Additionally, default rates are projected by considering collateral
characteristics including, but not limited to, LTV, FICO and
geographic concentration. Weighted-average life default rates by
collateral type were 27.7 percent for prime, 49.1 percent for Alt-
A and 34.1 percent for subprime at December 31, 2013.
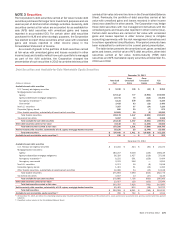
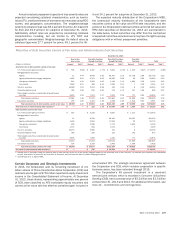
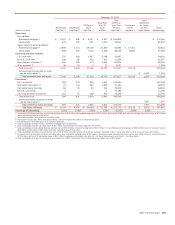
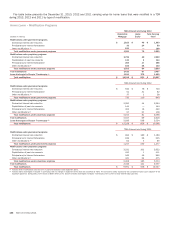
The expected maturity distribution of the Corporation’s MBS,
the contractual maturity distribution of the Corporation’s debt
securities carried at fair value and HTM debt securities, and the
yields on the Corporation’s debt securities carried at fair value and
HTM debt securities at December 31, 2013 are summarized in
the table below. Actual maturities may differ from the contractual
or expected maturities since borrowers may have the right to prepay
obligations with or without prepayment penalties.
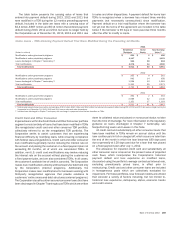
Maturities of Debt Securities Carried at Fair Value and Held-to-maturity Debt Securities
December 31, 2013
Due in One
Year or Less
Due after One Year
through Five Years
Due after Five Years
through Ten Years
Due after
Ten Years Total
(Dollars in millions) Amount Yield (1) Amount Yield (1) Amount Yield (1) Amount Yield (1) Amount Yield (1)
Amortized cost of debt securities carried at fair value
U.S. Treasury and agency securities $ 535 0.62% $ 2,337 1.71% $ 8,844 2.44% $ 1,339 3.84% $ 13,055 2.38%
Mortgage-backed securities:
Agency 11 4.44 9,649 2.93 90,407 3.10 87,728 2.96 187,795 3.03
Agency-collateralized mortgage obligations 1,482 0.01 3,373 2.09 18,036 2.96 29 0.93 22,920 2.63
Non-agency residential 815 4.10 2,200 4.06 1,149 3.13 1,960 2.59 6,124 3.42
Commercial 1,683 5.01 466 6.43 1,089 2.51 7 4.09 3,245 4.37
Non-U.S. securities 16,288 1.04 2,074 3.98 149 3.34 8 3.10 18,519 1.39
Corporate/Agency bonds 395 2.48 206 5.69 112 4.12 147 1.38 860 3.27
Other taxable securities, substantially all asset-backed
securities 6,655 1.58 7,274 1.37 2,105 2.06 771 0.84 16,805 1.50
Total taxable securities 27,864 1.46 27,579 2.56 121,891 3.01 91,989 2.95 269,323 2.78
Tax-exempt securities 195 1.66 2,324 1.49 2,429 1.90 1,019 0.61 5,967 1.54
Total amortized cost of debt securities carried at fair value $ 28,059 1.47 $ 29,903 2.46 $ 124,320 2.99 $ 93,008 2.92 $ 275,290 2.75
Amortized cost of held-to-maturity debt securities (2) $ — — $ 125 1.79 $ 53,699 2.60 $ 1,326 2.72 $ 55,150 2.61
Debt securities carried at fair value
U.S. Treasury and agency securities $ 537 $ 2,333 $ 8,831 $ 1,315 $ 13,016
Mortgage-backed securities:
Agency 11 9,708 88,191 83,525 181,435
Agency-collateralized mortgage obligations 1,480 3,284 17,916 30 22,710
Non-agency residential 805 2,236 1,173 2,025 6,239
Commercial 1,715 494 1,013 7 3,229
Non-U.S. securities 16,273 2,099 155 8 18,535
Corporate/Agency bonds 395 220 116 142 873
Other taxable securities, substantially all asset-backed
securities 6,656 7,280 2,120 774
16,830
Total taxable securities 27,872 27,654 119,515 87,826 262,867
Tax-exempt securities 194 2,319 2,409 1,006 5,928
Total debt securities carried at fair value $ 28,066 $ 29,973 $ 121,924 $ 88,832 $ 268,795
Fair value of held-to-maturity debt securities (2) $ — $ 125 $ 51,062 $ 1,243 $ 52,430
(1) Average yield is computed using the effective yield of each security at the end of the period, weighted based on the amortized cost of each security. The effective yield considers the contractual
coupon, amortization of premiums and accretion of discounts, and excludes the effect of related hedging derivatives.
(2) Substantially all U.S. agency MBS.
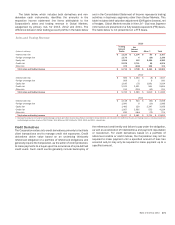
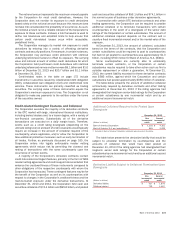
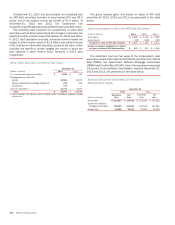
Certain Corporate and Strategic Investments
In 2013, the Corporation sold its remaining investment of 2.0
billion shares of China Construction Bank Corporation (CCB) and
realized a pre-tax gain of $753 million reported in equity investment
income in the Consolidated Statement of Income. At December
31, 2012, these shares, representing approximately one percent
of CCB, were classified as AFS marketable equity securities and
carried at fair value with the after-tax unrealized gain included in
accumulated OCI. The strategic assistance agreement between
the Corporation and CCB, which includes cooperation in specific
business areas, has been extended through 2016.
The Corporation’s 49 percent investment in a merchant
services joint venture, which is recorded in Consumer & Business
Banking (CBB), had a carrying value of $3.2 billion and $3.3 billion
at December 31, 2013 and 2012. For additional information, see
Note 12 – Commitments and Contingencies.