Bank of America 2013 Annual Report Download - page 28
Download and view the complete annual report
Please find page 28 of the 2013 Bank of America annual report below. You can navigate through the pages in the report by either clicking on the pages listed below, or by using the keyword search tool below to find specific information within the annual report.-
 1
1 -
2
-
3
-
4
-
5
-
6
-
7
-
8
-
9
-
10
-
11
-
12
-
13
-
14
-
15
-
16
-
17
-
 18
18 -
 19
19 -
 20
20 -
 21
21 -
 22
22 -
 23
23 -
 24
24 -
 25
25 -
 26
26 -
 27
27 -
 28
28 -
 29
29 -
 30
30 -
 31
31 -
 32
32 -
 33
33 -
 34
34 -
 35
35 -
 36
36 -
 37
37 -
 38
38 -
39
-
40
-
41
-
42
-
43
-
44
-
45
-
46
-
47
-
48
-
49
-
50
-
51
-
52
-
53
-
54
-
55
-
56
-
57
-
58
-
59
-
60
-
61
-
62
-
63
-
64
-
65
-
66
-
67
-
68
-
69
-
70
-
71
-
72
-
73
-
74
-
75
-
76
-
77
-
78
-
79
-
80
-
81
-
82
-
83
-
84
-
85
-
86
-
87
-
88
-
89
-
90
-
91
-
92
-
93
-
94
-
95
-
96
-
97
-
98
-
99
-
100
-
101
-
102
-
103
-
104
-
105
-
106
-
107
-
108
-
109
-
110
-
111
-
112
-
113
-
114
-
115
-
116
-
117
-
118
-
119
-
120
-
121
-
122
-
123
-
124
-
125
-
126
-
127
-
128
-
129
-
130
-
131
-
132
-
133
-
134
-
135
-
136
-
137
-
138
-
139
-
140
-
141
-
142
-
143
-
144
-
145
-
146
-
147
-
148
-
149
-
150
-
151
-
152
-
153
-
154
-
155
-
156
-
157
-
158
-
159
-
160
-
161
-
162
-
163
-
164
-
165
-
166
-
167
-
168
-
169
-
170
-
171
-
172
-
173
-
174
-
175
-
176
-
177
-
178
-
179
-
180
-
181
-
182
-
183
-
184
-
185
-
186
-
187
-
188
-
189
-
190
-
191
-
192
-
193
-
194
-
195
-
196
-
197
-
198
-
199
-
200
-
201
-
202
-
203
-
204
-
205
-
206
-
207
-
208
-
209
-
210
-
211
-
212
-
213
-
214
-
215
-
216
-
217
-
218
-
219
-
220
-
221
-
222
-
223
-
224
-
225
-
226
-
227
-
228
-
229
-
230
-
231
-
232
-
233
-
234
-
235
-
236
-
237
-
238
-
239
-
240
-
241
-
242
-
243
-
244
-
245
-
246
-
247
-
248
-
249
-
250
-
251
-
252
-
253
-
254
-
255
-
256
-
257
-
258
-
259
-
260
-
261
-
262
-
263
-
264
-
265
-
266
-
267
-
268
-
269
-
270
-
271
-
272
-
273
-
274
-
275
-
276
-
277
-
278
-
279
-
280
-
281
-
282
-
283
-
284
 |
 |
26 Bank of America 2013
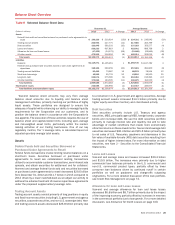
All Other Assets
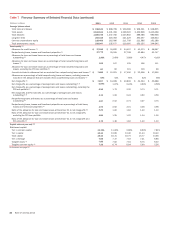
Year-end other assets decreased $42.1 billion driven by lower
customer and other receivables, other earning assets, loans held-
for-sale and derivative assets, partially offset by increases in cash
and cash equivalents. Average other assets decreased $43.1
billion primarily driven by lower derivative assets, other earning
assets, and cash and cash equivalents.
Liabilities
Deposits
Year-end and average deposits increased $14.0 billion from
December 31, 2012 and $42.0 billion in 2013 compared to 2012.
The increases were primarily driven by customer and client shifts
to more liquid products in the low rate environment.
Federal Funds Purchased and Securities Loaned or Sold
Under Agreements to Repurchase
Federal funds transactions involve borrowing reserve balances on
a short-term basis. Securities loaned or sold under agreements
to repurchase are collateralized borrowing transactions utilized to
accommodate customer transactions, earn interest rate spreads
and finance assets on the balance sheet. Year-end federal funds
purchased and securities loaned or sold under agreements to
repurchase decreased $95.2 billion primarily driven by a lower
matched-book as we adjust our activity to address the adverse
treatment of repurchase agreements under the proposed
supplementary leverage ratio and lower trading inventory. Average
federal funds purchased and securities loaned or sold under
agreements to repurchase decreased $24.3 billion due to lower
matched-book activity.
Trading Account Liabilities
Trading account liabilities consist primarily of short positions in
equity and fixed-income securities including U.S. government and
agency securities, corporate securities, and non-U.S. sovereign
debt. Year-end and average trading account liabilities increased
$9.9 billion and $9.8 billion primarily due to increased short
positions in equity securities.
Short-term Borrowings
Short-term borrowings provide an additional funding source and
primarily consist of Federal Home Loan Bank (FHLB) short-term
borrowings, notes payable and various other borrowings that
generally have maturities of one year or less. Year-end and average
short-term borrowings increased $15.3 billion and $7.3 billion due
to an increase in short-term FHLB advances. For more information
on short-term borrowings, see Note 10 – Federal Funds Sold or
Purchased, Securities Financing Agreements and Short-term
Borrowings to the Consolidated Financial Statements.
Long-term Debt
Year-end and average long-term debt decreased $25.9 billion and
$53.0 billion. The decreases were attributable to planned
reductions in long-term debt as maturities outpaced new
issuances. For more information on long-term debt, see Note 11
– Long-term Debt to the Consolidated Financial Statements.
All Other Liabilities
Year-end all other liabilities decreased $21.5 billion driven by
decreases in noninterest payables and derivative liabilities.
Average all other liabilities decreased $7.9 billion driven by a
decrease in derivative liabilities.
Shareholders’ Equity
Year-end and average shareholders’ equity decreased $4.3 billion
and $1.7 billion. The decreases were driven by a decrease in the
fair value of AFS debt securities resulting from the impact of higher
interest rates, which is recorded in accumulated other
comprehensive income (OCI), net preferred stock redemptions and
common stock repurchases, partially offset by earnings.
Cash Flows Overview
The Corporation’s operating assets and liabilities support our
global markets and lending activities. We believe that cash flows
from operations, available cash balances and our ability to
generate cash through short- and long-term debt are sufficient to
fund our operating liquidity needs. Our investing activities primarily
include the debt securities portfolio and other short-term
investments. Our financing activities reflect cash flows primarily
related to increased customer deposits and net long-term debt
reductions.
Cash and cash equivalents increased $20.6 billion during 2013
due to net cash provided by operating and investing activities,
partially offset by net cash used in financing activities. Cash and
cash equivalents decreased $9.4 billion during 2012 due to net
cash used in operating and investing activities, partially offset by
net cash provided by financing activities.
During 2013, net cash provided by operating activities was
$92.8 billion. The more significant adjustments to net income to
arrive at cash used in operating activities included net decreases
in other assets, and trading and derivative instruments, as well
as net proceeds from sales, securitizations and paydowns of loans
held-for-sale (LHFS). During 2012, net cash used in operating
activities was $16.1 billion. The more significant adjustments to
net income to arrive at cash used in operating activities included
net increases in trading and derivative instruments, and the
provision for credit losses.
During 2013, net cash provided by investing activities was
$25.1 billion primarily driven by a decrease in federal funds sold
and securities borrowed or purchased under agreements to resell
and net sales of debt securities, partially offset by net increases
in loans and leases. During 2012, net cash used in investing
activities was $35.0 billion, primarily driven by net purchases of
debt securities.
During 2013, net cash used in financing activities of $95.4
billion primarily reflected a decrease in federal funds purchased
and securities loaned or sold under agreements to repurchase
and net reductions in long-term debt, partially offset by growth in
short-term borrowings and deposits. During 2012, the net cash
provided by financing activities of $42.4 billion primarily reflected
an increase in federal funds purchased and securities loaned or
sold under agreements to repurchase and growth in deposits,
partially offset by planned reductions in long-term debt.