Bank of America 2013 Annual Report Download - page 82
Download and view the complete annual report
Please find page 82 of the 2013 Bank of America annual report below. You can navigate through the pages in the report by either clicking on the pages listed below, or by using the keyword search tool below to find specific information within the annual report.-
 1
1 -
2
-
3
-
4
-
5
-
6
-
7
-
8
-
9
-
10
-
11
-
12
-
13
-
14
-
15
-
16
-
17
-
18
-
19
-
20
-
21
-
22
-
23
-
24
-
25
-
26
-
27
-
28
-
29
-
30
-
31
-
32
-
33
-
34
-
35
-
36
-
37
-
38
-
39
-
40
-
41
-
42
-
43
-
44
-
45
-
46
-
47
-
48
-
49
-
50
-
51
-
52
-
53
-
54
-
55
-
56
-
57
-
58
-
59
-
60
-
61
-
62
-
63
-
64
-
65
-
66
-
67
-
68
-
69
-
70
-
71
-
 72
72 -
 73
73 -
 74
74 -
 75
75 -
 76
76 -
 77
77 -
 78
78 -
 79
79 -
 80
80 -
 81
81 -
 82
82 -
 83
83 -
 84
84 -
 85
85 -
 86
86 -
 87
87 -
 88
88 -
 89
89 -
 90
90 -
 91
91 -
 92
92 -
93
-
94
-
95
-
96
-
97
-
98
-
99
-
100
-
101
-
102
-
103
-
104
-
105
-
106
-
107
-
108
-
109
-
110
-
111
-
112
-
113
-
114
-
115
-
116
-
117
-
118
-
119
-
120
-
121
-
122
-
123
-
124
-
125
-
126
-
127
-
128
-
129
-
130
-
131
-
132
-
133
-
134
-
135
-
136
-
137
-
138
-
139
-
140
-
141
-
142
-
143
-
144
-
145
-
146
-
147
-
148
-
149
-
150
-
151
-
152
-
153
-
154
-
155
-
156
-
157
-
158
-
159
-
160
-
161
-
162
-
163
-
164
-
165
-
166
-
167
-
168
-
169
-
170
-
171
-
172
-
173
-
174
-
175
-
176
-
177
-
178
-
179
-
180
-
181
-
182
-
183
-
184
-
185
-
186
-
187
-
188
-
189
-
190
-
191
-
192
-
193
-
194
-
195
-
196
-
197
-
198
-
199
-
200
-
201
-
202
-
203
-
204
-
205
-
206
-
207
-
208
-
209
-
210
-
211
-
212
-
213
-
214
-
215
-
216
-
217
-
218
-
219
-
220
-
221
-
222
-
223
-
224
-
225
-
226
-
227
-
228
-
229
-
230
-
231
-
232
-
233
-
234
-
235
-
236
-
237
-
238
-
239
-
240
-
241
-
242
-
243
-
244
-
245
-
246
-
247
-
248
-
249
-
250
-
251
-
252
-
253
-
254
-
255
-
256
-
257
-
258
-
259
-
260
-
261
-
262
-
263
-
264
-
265
-
266
-
267
-
268
-
269
-
270
-
271
-
272
-
273
-
274
-
275
-
276
-
277
-
278
-
279
-
280
-
281
-
282
-
283
-
284
 |
 |
80 Bank of America 2013
of 30 to 89 days past due junior-lien loans were behind a delinquent
first-lien loan. We service the first-lien loans on $421 million of
these combined amounts, with the remaining $2.1 billion serviced
by third parties. Of the $2.5 billion of current to 89 days past due
junior-lien loans, based on available credit bureau data and our
own internal servicing data, we estimate that approximately $1.2
billion had first-lien loans that were 90 days or more past due.
Net charge-offs decreased $2.4 billion to $1.8 billion, or 1.94
percent of the total average home equity portfolio in 2013
compared to $4.2 billion, or 3.99 percent in 2012. The decrease
in net charge-offs was primarily driven by favorable portfolio trends
due in part to improvement in home prices and the U.S. economy.
Also, 2012 included charge-offs associated with the National
Mortgage Settlement and loans discharged in Chapter 7
bankruptcy due to the implementation of regulatory guidance in
2012. The net charge-off ratio in 2013 was impacted by lower
outstanding balances primarily as a result of paydowns and charge-
offs outpacing new originations and draws on existing lines.
There are certain characteristics of the home equity portfolio
that have contributed to higher losses including those loans with
a high refreshed combined loan-to-value (CLTV), loans that were
originated at the peak of home prices in 2006 and 2007, and
loans in geographic areas that have experienced the most
significant declines in home prices. Although we have seen recent
home price appreciation, home price declines since 2006 coupled
with the fact that most home equity outstandings are secured by
second-lien positions have significantly reduced and, in some
cases, eliminated all collateral value after consideration of the
first-lien position. Although the disclosures in this section address
each of these risk characteristics separately, there is significant
overlap in outstanding balances with these characteristics, which
has contributed to a disproportionate share of losses in the
portfolio. Outstanding balances in the home equity portfolio with
all of these higher risk characteristics comprised five percent and
eight percent of the total home equity portfolio at December 31,
2013 and 2012, and accounted for 20 percent of the home equity
net charge-offs in 2013 compared to 24 percent in 2012.
Outstanding balances in the home equity portfolio with greater
than 90 percent but less than or equal to 100 percent refreshed
CLTVs comprised nine percent and 10 percent of the home equity
portfolio at December 31, 2013 and 2012. Outstanding balances
with refreshed CLTVs greater than 100 percent comprised 19
percent and 29 percent of the home equity portfolio at December
31, 2013 and 2012. Outstanding balances in the home equity
portfolio with a refreshed CLTV greater than 100 percent reflect
loans where the carrying value and available line of credit of the
combined loans are equal to or greater than the most recent
valuation of the property securing the loan. Depending on the value
of the property, there may be collateral in excess of the first-lien
that is available to reduce the severity of loss on the second-lien.
Home price deterioration since 2006, somewhat mitigated by
recent appreciation, has contributed to an increase in CLTV ratios.
Of those outstanding balances with a refreshed CLTV greater than
100 percent, 96 percent of the customers were current on their
home equity loan and 91 percent of second-lien loans with a
refreshed CLTV greater than 100 percent were current on both
their second-lien and underlying first-lien loans at December 31,
2013. Outstanding balances in the home equity portfolio to
borrowers with a refreshed FICO score below 620 represented
eight percent of the home equity portfolio at both December 31,
2013 and 2012.
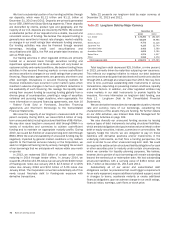
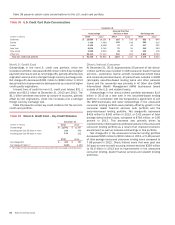
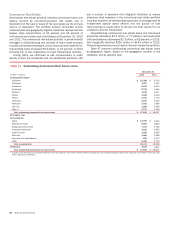
Of the $87.1 billion in total home equity portfolio outstandings
at December 31, 2013, as shown in Table 33, 76 percent were
interest-only loans, almost all of which were HELOCs. The
outstanding balance of HELOCs that have entered the amortization
period was $2.6 billion, or three percent of total HELOCs at
December 31, 2013. The HELOCs that have entered the
amortization period have experienced a higher percentage of early
stage delinquencies and nonperforming status when compared to
the HELOC portfolio as a whole. At December 31, 2013, $78
million, or three percent of outstanding HELOCs that had entered
the amortization period were accruing past due 30 days or more
compared to $817 million, or one percent for the entire HELOC
portfolio. In addition, at December 31, 2013, $211 million, or eight
percent of outstanding HELOCs that had entered the amortization
period were nonperforming compared to $3.6 billion, or four
percent for the entire HELOC portfolio. Loans in our HELOC
portfolio generally have an initial draw period of 10 years and more
than 85 percent of these loans will not be required to make a fully-
amortizing payment until 2015 or later.
Although we do not actively track how many of our home equity
customers pay only the minimum amount due on their home equity
loans and lines, we can infer some of this information through a
review of our HELOC portfolio that we service and that is still in
its revolving period (i.e., customers may draw on and repay their
line of credit, but are generally only required to pay interest on a
monthly basis). During 2013, approximately 41 percent of these
customers with an outstanding balance did not pay principal on
their HELOCs.