Bank of America 2013 Annual Report Download - page 252
Download and view the complete annual report
Please find page 252 of the 2013 Bank of America annual report below. You can navigate through the pages in the report by either clicking on the pages listed below, or by using the keyword search tool below to find specific information within the annual report.-
 1
1 -
2
-
3
-
4
-
5
-
6
-
7
-
8
-
9
-
10
-
11
-
12
-
13
-
14
-
15
-
16
-
17
-
18
-
19
-
20
-
21
-
22
-
23
-
24
-
25
-
26
-
27
-
28
-
29
-
30
-
31
-
32
-
33
-
34
-
35
-
36
-
37
-
38
-
39
-
40
-
41
-
42
-
43
-
44
-
45
-
46
-
47
-
48
-
49
-
50
-
51
-
52
-
53
-
54
-
55
-
56
-
57
-
58
-
59
-
60
-
61
-
62
-
63
-
64
-
65
-
66
-
67
-
68
-
69
-
70
-
71
-
72
-
73
-
74
-
75
-
76
-
77
-
78
-
79
-
80
-
81
-
82
-
83
-
84
-
85
-
86
-
87
-
88
-
89
-
90
-
91
-
92
-
93
-
94
-
95
-
96
-
97
-
98
-
99
-
100
-
101
-
102
-
103
-
104
-
105
-
106
-
107
-
108
-
109
-
110
-
111
-
112
-
113
-
114
-
115
-
116
-
117
-
118
-
119
-
120
-
121
-
122
-
123
-
124
-
125
-
126
-
127
-
128
-
129
-
130
-
131
-
132
-
133
-
134
-
135
-
136
-
137
-
138
-
139
-
140
-
141
-
142
-
143
-
144
-
145
-
146
-
147
-
148
-
149
-
150
-
151
-
152
-
153
-
154
-
155
-
156
-
157
-
158
-
159
-
160
-
161
-
162
-
163
-
164
-
165
-
166
-
167
-
168
-
169
-
170
-
171
-
172
-
173
-
174
-
175
-
176
-
177
-
178
-
179
-
180
-
181
-
182
-
183
-
184
-
185
-
186
-
187
-
188
-
189
-
190
-
191
-
192
-
193
-
194
-
195
-
196
-
197
-
198
-
199
-
200
-
201
-
202
-
203
-
204
-
205
-
206
-
207
-
208
-
209
-
210
-
211
-
212
-
213
-
214
-
215
-
216
-
217
-
218
-
219
-
220
-
221
-
222
-
223
-
224
-
225
-
226
-
227
-
228
-
229
-
230
-
231
-
232
-
233
-
234
-
235
-
236
-
237
-
238
-
239
-
240
-
241
-
 242
242 -
 243
243 -
 244
244 -
 245
245 -
 246
246 -
 247
247 -
 248
248 -
 249
249 -
 250
250 -
 251
251 -
 252
252 -
 253
253 -
 254
254 -
 255
255 -
 256
256 -
 257
257 -
 258
258 -
 259
259 -
 260
260 -
 261
261 -
 262
262 -
263
-
264
-
265
-
266
-
267
-
268
-
269
-
270
-
271
-
272
-
273
-
274
-
275
-
276
-
277
-
278
-
279
-
280
-
281
-
282
-
283
-
284
 |
 |

250 Bank of America 2013
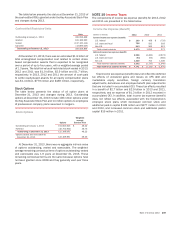
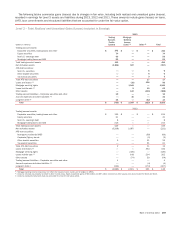
Income tax expense (benefit) for 2013, 2012 and 2011 varied from the amount computed by applying the statutory income tax rate
to income (loss) before income taxes. A reconciliation of the expected U.S. federal income tax expense is calculated by applying the
federal statutory tax rate of 35 percent to the Corporation’s actual income tax expense (benefit) and the effective tax rates for 2013,
2012 and 2011 are presented in the table below.
Reconciliation of Income Tax Expense (Benefit)
2013 2012 2011
(Dollars in millions) Amount Percent Amount Percent Amount Percent
Expected U.S. federal income tax expense (benefit) $ 5,660 35.0 % $ 1,075 35.0 % $ (81) 35.0 %
Increase (decrease) in taxes resulting from: (0.001)% (0.001)% (0.001)%
State tax expense (benefit), net of federal effect 450 2.8 349 11.4 (124)
Non-U.S. tax differential (1) (940) (5.8) (1,968) (64.1) (383)
Affordable housing credits/other credits (863) (5.3) (783) (25.5) (800)
Tax-exempt income, including dividends (524) (3.2) (576) (18.8) (614)
Changes in prior period UTBs, including interest (255) (1.6) (198) (6.4) (239)
Non-U.S. statutory rate reductions 1,133 7.0 788 25.7 860
Nondeductible expenses 52 0.3 231 7.5 119
Goodwill – impairment and other goodwill impacts 52 0.3 — — 1,420
Change in federal and non-U.S. valuation allowances 26 0.2 41 1.3 (1,102)
Leveraged lease tax differential 26 0.2 83 2.7 121
Subsidiary sales and liquidations —— — — (823)
Other (76) (0.6) (158) (5.1) (30)
Total income tax expense (benefit) $ 4,741 29.3 % $ (1,116) (36.3)% $ (1,676) n/m
(1) Includes in 2012, $1.7 billion income tax benefit attributable to the excess of foreign tax credits recognized in the U.S. upon repatriation of the earnings of certain non-U.S. subsidiaries over the
related U.S. tax liability.
n/m = not meaningful
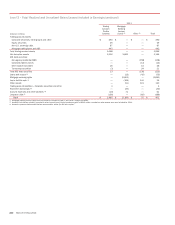
The reconciliation of the beginning unrecognized tax benefits (UTB) balance to the ending balance is presented in the table below.
Reconciliation of the Change in Unrecognized Tax Benefits
(Dollars in millions) 2013 2012 2011
Balance, January 1 $ 3,677 $ 4,203 $ 5,169
Increases related to positions taken during the current year 98 352 219
Increases related to positions taken during prior years (1) 254 142 879
Decreases related to positions taken during prior years (1) (508)(711) (1,669)
Settlements (448)(205) (277)
Expiration of statute of limitations (5)(104) (118)
Balance, December 31 $ 3,068 $ 3,677 $ 4,203
(1) The sum per year of positions taken during prior years differs from the $255 million, $198 million and $239 million in the Reconciliation of Income Tax Expense (Benefit) table due to temporary
items and jurisdictional offsets, as well as the inclusion of interest in the Reconciliation of Income Tax Expense (Benefit) table.
At December 31, 2013, 2012 and 2011, the balance of the
Corporation’s UTBs which would, if recognized, affect the
Corporation’s effective tax rate was $2.5 billion, $3.1 billion and
$3.3 billion, respectively. Included in the UTB balance are some
items the recognition of which would not affect the effective tax
rate, such as the tax effect of certain temporary differences, the
portion of gross state UTBs that would be offset by the tax benefit
of the associated federal deduction and the portion of gross non-
U.S. UTBs that would be offset by tax reductions in other
jurisdictions.
The Corporation files income tax returns in more than 100 state
and non-U.S. jurisdictions each year. The IRS and other tax
authorities in countries and states in which the Corporation has
significant business operations examine tax returns periodically
(continuously in some jurisdictions). The Tax Examination Status
table summarizes the status of significant examinations (U.S.
federal unless otherwise noted) for the Corporation and various
subsidiaries as of December 31, 2013.
Tax Examination Status
Years under
Examination
Status at
December 31
2013
Bank of America Corporation – U.S. 2005 – 2009 See below
Bank of America Corporation – U.S. 2010 – 2011 Field examination
Bank of America Corporation – New York (1) 2004 – 2008 Field examination
Merrill Lynch – U.S. 2004 – 2008 See below
Various – U.K. 2012 Field examination
(1) All tax years subsequent to the years shown remain open to examination.
During 2013, the Corporation and the IRS arrived at final
resolution of the Bank of America Corporation 2001 through 2004
tax years and continued to make progress toward resolving all
federal income tax examinations through 2009, including Merrill
Lynch. While subject to final agreement, including review by the
Joint Committee on Taxation of the U.S. Congress for certain years,
the Corporation believes that these examinations may be
concluded during 2014.