Bank of America 2013 Annual Report Download - page 260
Download and view the complete annual report
Please find page 260 of the 2013 Bank of America annual report below. You can navigate through the pages in the report by either clicking on the pages listed below, or by using the keyword search tool below to find specific information within the annual report.-
 1
1 -
2
-
3
-
4
-
5
-
6
-
7
-
8
-
9
-
10
-
11
-
12
-
13
-
14
-
15
-
16
-
17
-
18
-
19
-
20
-
21
-
22
-
23
-
24
-
25
-
26
-
27
-
28
-
29
-
30
-
31
-
32
-
33
-
34
-
35
-
36
-
37
-
38
-
39
-
40
-
41
-
42
-
43
-
44
-
45
-
46
-
47
-
48
-
49
-
50
-
51
-
52
-
53
-
54
-
55
-
56
-
57
-
58
-
59
-
60
-
61
-
62
-
63
-
64
-
65
-
66
-
67
-
68
-
69
-
70
-
71
-
72
-
73
-
74
-
75
-
76
-
77
-
78
-
79
-
80
-
81
-
82
-
83
-
84
-
85
-
86
-
87
-
88
-
89
-
90
-
91
-
92
-
93
-
94
-
95
-
96
-
97
-
98
-
99
-
100
-
101
-
102
-
103
-
104
-
105
-
106
-
107
-
108
-
109
-
110
-
111
-
112
-
113
-
114
-
115
-
116
-
117
-
118
-
119
-
120
-
121
-
122
-
123
-
124
-
125
-
126
-
127
-
128
-
129
-
130
-
131
-
132
-
133
-
134
-
135
-
136
-
137
-
138
-
139
-
140
-
141
-
142
-
143
-
144
-
145
-
146
-
147
-
148
-
149
-
150
-
151
-
152
-
153
-
154
-
155
-
156
-
157
-
158
-
159
-
160
-
161
-
162
-
163
-
164
-
165
-
166
-
167
-
168
-
169
-
170
-
171
-
172
-
173
-
174
-
175
-
176
-
177
-
178
-
179
-
180
-
181
-
182
-
183
-
184
-
185
-
186
-
187
-
188
-
189
-
190
-
191
-
192
-
193
-
194
-
195
-
196
-
197
-
198
-
199
-
200
-
201
-
202
-
203
-
204
-
205
-
206
-
207
-
208
-
209
-
210
-
211
-
212
-
213
-
214
-
215
-
216
-
217
-
218
-
219
-
220
-
221
-
222
-
223
-
224
-
225
-
226
-
227
-
228
-
229
-
230
-
231
-
232
-
233
-
234
-
235
-
236
-
237
-
238
-
239
-
240
-
241
-
242
-
243
-
244
-
245
-
246
-
247
-
248
-
249
-
 250
250 -
 251
251 -
 252
252 -
 253
253 -
 254
254 -
 255
255 -
 256
256 -
 257
257 -
 258
258 -
 259
259 -
 260
260 -
 261
261 -
 262
262 -
 263
263 -
 264
264 -
 265
265 -
 266
266 -
 267
267 -
 268
268 -
 269
269 -
 270
270 -
271
-
272
-
273
-
274
-
275
-
276
-
277
-
278
-
279
-
280
-
281
-
282
-
283
-
284
 |
 |

258 Bank of America 2013
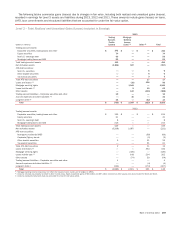
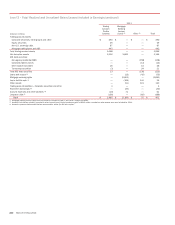
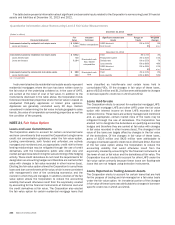
Level 3 – Fair Value Measurements (1)
2011
Gross
(Dollars in millions)
Balance
January 1
2011
Consolidation
of VIEs
Gains
(Losses)
in Earnings
Gains
(Losses)
in OCI Purchases Sales Issuances Settlements
Gross
Transfers
into
Level 3
Gross
Transfers
out of
Level 3
Balance
December 31
2011
Trading account assets:
Corporate securities, trading
loans and other $ 7,751 $ — $ 490 $ — $ 5,683 $ (6,664) $ — $ (1,362) $ 1,695 $ (713) $ 6,880
Equity securities 557 — 49 — 335 (362) — (140) 132 (27) 544
Non-U.S. sovereign debt 243 — 87 — 188 (137) — (3) 8 (44) 342
Mortgage trading loans and ABS 6,908 — 442 — 2,222 (4,713) — (440) 75 (805) 3,689
Total trading account assets 15,459 — 1,068 — 8,428 (11,876) — (1,945) 1,910 (1,589) 11,455
Net derivative assets (2) 7,745 — 5,199 — 1,235 (1,553) — (7,779) 1,199 (180) 5,866
AFS debt securities:
Mortgage-backed securities:
Agency 4 — — — 14 (11) — — 34 (4) 37
Agency collateralized-mortgage
obligations — — — — 56 (56) — — — — —
Non-agency residential 1,468 — (158) 41 11 (307) — (568) 373 — 860
Non-agency commercial 19 — — — 15 — — — 6 — 40
Non-U.S. securities 3 — — — — — — — 88 (91) —
Corporate/Agency bonds 137 — (12) (8) 304 (17) — — 7 (249) 162
Other taxable securities 13,018 — 26 21 3,876 (2,245) — (5,112) 2 (5,321) 4,265
Tax-exempt securities 1,224 — 21 (35) 2,862 (92) — (697) 38 (673) 2,648
Total AFS debt securities 15,873 — (123) 19 7,138 (2,728) — (6,377) 548 (6,338) 8,012
Loans and leases (3, 4) 3,321 5,194 (55) — 21 (2,644) 3,118 (1,830) 5 (4,386) 2,744
Mortgage servicing rights (4) 14,900 — (5,661) — — (896) 1,656 (2,621) — — 7,378
Loans held-for-sale (3) 4,140 — 36 — 157 (483) — (961) 565 (67) 3,387
Other assets (5) 6,922 — 140 — 1,932 (2,391) — (768) 375 (1,975) 4,235
Trading account liabilities –
Corporate securities and other (7) — 4 — 133 (189) — — (65) 10 (114)
Short-term borrowings (3) (706) — (30) — — — — 86 — 650 —
Accrued expenses and other
liabilities (3) (828) — 61 — — (2) (9) 3 — 761 (14)
Long-term debt (3) (2,986) — (188) — 520 (72) (520) 838 (2,111) 1,576 (2,943)
(1) Assets (liabilities). For assets, increase (decrease) to Level 3 and for liabilities, (increase) decrease to Level 3.
(2) Net derivatives include derivative assets of $14.4 billion and derivative liabilities of $8.5 billion.
(3) Amounts represent instruments that are accounted for under the fair value option.
(4) Issuances represent loan originations and mortgage servicing rights retained following securitizations or whole-loan sales.
(5) Other assets is primarily comprised of net monoline exposure to a single counterparty and private equity investments.
During 2011, the transfers into Level 3 included $1.9 billion of
trading account assets, $1.2 billion of net derivative assets and
$2.1 billion of long-term debt. Transfers into Level 3 for trading
account assets were primarily certain CLOs, corporate loans and
bonds that were transferred due to decreased market activity.
Transfers into Level 3 for net derivative assets were the result of
changes in the valuation methodology for certain total return
swaps, in addition to increases in certain equity derivatives with
significant unobservable inputs. Transfers into Level 3 for long-
term debt were primarily due to changes in the impact of
unobservable inputs on the value of certain structured liabilities.
Transfers occur on a regular basis for these long-term debt
instruments due to changes in the impact of unobservable inputs
on the value of the embedded derivative in relation to the
instrument as a whole.
During 2011, the transfers out of Level 3 included $1.6 billion
of trading account assets, $6.3 billion of AFS debt securities, $4.4
billion of loans and leases, $2.0 billion of other assets and $1.6
billion of long-term debt. Transfers out of Level 3 for trading account
assets were primarily due to increased price observability on
certain RMBS, CMBS and consumer ABS portfolios, as well as
certain corporate bond positions due to increased trading volume.
Transfers out of Level 3 for AFS debt securities primarily related
to auto, credit card and student loan ABS portfolios due to
increased trading volume in the secondary market for similar
securities. Transfers out of Level 3 for loans and leases were due
to increased observable inputs, primarily liquid comparables, for
certain corporate loans. Transfers out of Level 3 for other assets
were primarily the result of an IPO of an equity investment.
Transfers out of Level 3 for long-term debt were primarily due to
changes in the impact of unobservable inputs on the value of
certain structured liabilities.