Bank of America 2013 Annual Report Download - page 258
Download and view the complete annual report
Please find page 258 of the 2013 Bank of America annual report below. You can navigate through the pages in the report by either clicking on the pages listed below, or by using the keyword search tool below to find specific information within the annual report.-
 1
1 -
2
-
3
-
4
-
5
-
6
-
7
-
8
-
9
-
10
-
11
-
12
-
13
-
14
-
15
-
16
-
17
-
18
-
19
-
20
-
21
-
22
-
23
-
24
-
25
-
26
-
27
-
28
-
29
-
30
-
31
-
32
-
33
-
34
-
35
-
36
-
37
-
38
-
39
-
40
-
41
-
42
-
43
-
44
-
45
-
46
-
47
-
48
-
49
-
50
-
51
-
52
-
53
-
54
-
55
-
56
-
57
-
58
-
59
-
60
-
61
-
62
-
63
-
64
-
65
-
66
-
67
-
68
-
69
-
70
-
71
-
72
-
73
-
74
-
75
-
76
-
77
-
78
-
79
-
80
-
81
-
82
-
83
-
84
-
85
-
86
-
87
-
88
-
89
-
90
-
91
-
92
-
93
-
94
-
95
-
96
-
97
-
98
-
99
-
100
-
101
-
102
-
103
-
104
-
105
-
106
-
107
-
108
-
109
-
110
-
111
-
112
-
113
-
114
-
115
-
116
-
117
-
118
-
119
-
120
-
121
-
122
-
123
-
124
-
125
-
126
-
127
-
128
-
129
-
130
-
131
-
132
-
133
-
134
-
135
-
136
-
137
-
138
-
139
-
140
-
141
-
142
-
143
-
144
-
145
-
146
-
147
-
148
-
149
-
150
-
151
-
152
-
153
-
154
-
155
-
156
-
157
-
158
-
159
-
160
-
161
-
162
-
163
-
164
-
165
-
166
-
167
-
168
-
169
-
170
-
171
-
172
-
173
-
174
-
175
-
176
-
177
-
178
-
179
-
180
-
181
-
182
-
183
-
184
-
185
-
186
-
187
-
188
-
189
-
190
-
191
-
192
-
193
-
194
-
195
-
196
-
197
-
198
-
199
-
200
-
201
-
202
-
203
-
204
-
205
-
206
-
207
-
208
-
209
-
210
-
211
-
212
-
213
-
214
-
215
-
216
-
217
-
218
-
219
-
220
-
221
-
222
-
223
-
224
-
225
-
226
-
227
-
228
-
229
-
230
-
231
-
232
-
233
-
234
-
235
-
236
-
237
-
238
-
239
-
240
-
241
-
242
-
243
-
244
-
245
-
246
-
247
-
 248
248 -
 249
249 -
 250
250 -
 251
251 -
 252
252 -
 253
253 -
 254
254 -
 255
255 -
 256
256 -
 257
257 -
 258
258 -
 259
259 -
 260
260 -
 261
261 -
 262
262 -
 263
263 -
 264
264 -
 265
265 -
 266
266 -
 267
267 -
 268
268 -
269
-
270
-
271
-
272
-
273
-
274
-
275
-
276
-
277
-
278
-
279
-
280
-
281
-
282
-
283
-
284
 |
 |

256 Bank of America 2013
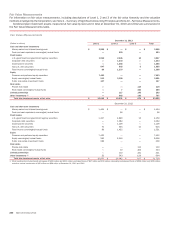
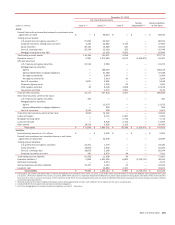
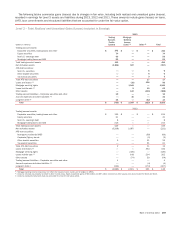
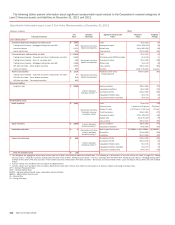
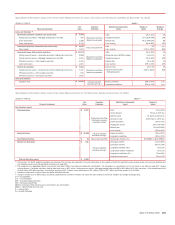
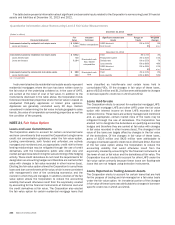
The following tables present a reconciliation of all assets and liabilities measured at fair value on a recurring basis using significant
unobservable inputs (Level 3) during 2013, 2012 and 2011, including net realized and unrealized gains (losses) included in earnings
and accumulated OCI.
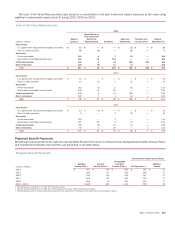
Level 3 – Fair Value Measurements (1)
2013
Gross
(Dollars in millions)
Balance
January 1
2013
Gains
(Losses)
in Earnings
Gains
(Losses)
in OCI Purchases Sales Issuances Settlements
Gross
Transfers
into
Level 3
Gross
Transfers
out of
Level 3
Balance
December 31
2013
Trading account assets:
Corporate securities, trading loans and
other $ 3,726 $ 242 $ — $ 3,848 $ (3,110) $ 59 $ (651) $ 890 $(1,445) $ 3,559
Equity securities 545 74 — 96 (175) — (100) 70 (124) 386
Non-U.S. sovereign debt 353 50 — 122 (18) — (36) 2 (5) 468
Mortgage trading loans and ABS 4,935 53 — 2,514 (1,993) — (868) 20 (30) 4,631
Total trading account assets 9,559 419 — 6,580 (5,296)59
(1,655)982 (1,604) 9,044
Net derivative assets (2) 1,468 (297) — 824 (1,274)—
(1,362)(10)
627 (24)
AFS debt securities:
Commercial MBS 10 —————(10)—— —
Non-U.S. securities —521(1)——
100 — 107
Corporate/Agency bonds 92 — 4——— — —(96) —
Other taxable securities 3,928 9 15 1,055 — — (1,155)—(5
) 3,847
Tax-exempt securities 1,061 3 19 — — — (109) — (168) 806
Total AFS debt securities 5,091 17 40 1,056 (1) — (1,274)100 (269) 4,760
Loans and leases (3, 4) 2,287 98 — 310 (128) 1,252 (757) 19 (24) 3,057
Mortgage servicing rights (4) 5,716 1,941 — — (2,044)472 (1,043)——
5,042
Loans held-for-sale (3) 2,733 62 — 8 (402) 4 (1,507)34 (3) 929
Other assets (5) 3,129 (288) — 46 (383) — (1,019)239 (55) 1,669
Trading account liabilities – Corporate
securities and other (64) 10 — 43 (54) (5) — (9)44 (35)
Accrued expenses and other liabilities (3) (15) 30 — — — (751) 724 (1)3(10)
Long-term debt (3) (2,301) 13 — 358 (4) (172) 258 (1,331) 1,189 (1,990)
(1) Assets (liabilities). For assets, increase (decrease) to Level 3 and for liabilities, (increase) decrease to Level 3.
(2) Net derivatives include derivative assets of $7.3 billion and derivative liabilities of $7.3 billion.
(3) Amounts represent instruments that are accounted for under the fair value option.
(4) Issuances represent loan originations and mortgage servicing rights retained following securitizations or whole-loan sales.
(5) Other assets is primarily comprised of private equity investments and certain long-term fixed-rate margin loans that are accounted for under the fair value option.
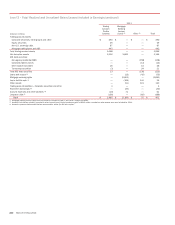
During 2013, the transfers into Level 3 included $982 million
of trading account assets, $100 million of AFS debt securities,
$239 million of other assets and $1.3 billion of long-term debt.
Transfers into Level 3 for trading account assets were primarily
the result of decreased third-party prices available for certain
corporate loans and securities. Transfers into Level 3 for AFS debt
securities were primarily due to decreased price observability.
Transfers into Level 3 for other assets were primarily due to a lack
of independent pricing data for certain receivables. Transfers into
Level 3 for long-term debt were primarily due to changes in the
impact of unobservable inputs on the value of certain structured
liabilities. Transfers occur on a regular basis for these long-term
debt instruments due to changes in the impact of unobservable
inputs on the value of the embedded derivative in relation to the
instrument as a whole.
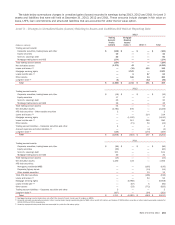
During 2013, the transfers out of Level 3 included $1.6 billion
of trading account assets, $627 million of net derivative assets,
$269 million for AFS debt securities and $1.2 billion of long-term
debt. Transfers out of Level 3 for trading account assets were
primarily the result of increased market liquidity and third-party
prices available for certain corporate loans and securities.
Transfers out of Level 3 for net derivative assets were primarily
due to increased price observability (i.e., market comparables for
the referenced instruments) for certain options. Transfers out of
Level 3 for AFS debt securities were primarily due to increased
market liquidity. Transfers out of Level 3 for long-term debt were
primarily due to changes in the impact of unobservable inputs on
the value of certain structured liabilities.