Bank of America 2013 Annual Report Download - page 113
Download and view the complete annual report
Please find page 113 of the 2013 Bank of America annual report below. You can navigate through the pages in the report by either clicking on the pages listed below, or by using the keyword search tool below to find specific information within the annual report.-
 1
1 -
2
-
3
-
4
-
5
-
6
-
7
-
8
-
9
-
10
-
11
-
12
-
13
-
14
-
15
-
16
-
17
-
18
-
19
-
20
-
21
-
22
-
23
-
24
-
25
-
26
-
27
-
28
-
29
-
30
-
31
-
32
-
33
-
34
-
35
-
36
-
37
-
38
-
39
-
40
-
41
-
42
-
43
-
44
-
45
-
46
-
47
-
48
-
49
-
50
-
51
-
52
-
53
-
54
-
55
-
56
-
57
-
58
-
59
-
60
-
61
-
62
-
63
-
64
-
65
-
66
-
67
-
68
-
69
-
70
-
71
-
72
-
73
-
74
-
75
-
76
-
77
-
78
-
79
-
80
-
81
-
82
-
83
-
84
-
85
-
86
-
87
-
88
-
89
-
90
-
91
-
92
-
93
-
94
-
95
-
96
-
97
-
98
-
99
-
100
-
101
-
102
-
 103
103 -
 104
104 -
 105
105 -
 106
106 -
 107
107 -
 108
108 -
 109
109 -
 110
110 -
 111
111 -
 112
112 -
 113
113 -
 114
114 -
 115
115 -
 116
116 -
 117
117 -
 118
118 -
 119
119 -
 120
120 -
 121
121 -
 122
122 -
 123
123 -
124
-
125
-
126
-
127
-
128
-
129
-
130
-
131
-
132
-
133
-
134
-
135
-
136
-
137
-
138
-
139
-
140
-
141
-
142
-
143
-
144
-
145
-
146
-
147
-
148
-
149
-
150
-
151
-
152
-
153
-
154
-
155
-
156
-
157
-
158
-
159
-
160
-
161
-
162
-
163
-
164
-
165
-
166
-
167
-
168
-
169
-
170
-
171
-
172
-
173
-
174
-
175
-
176
-
177
-
178
-
179
-
180
-
181
-
182
-
183
-
184
-
185
-
186
-
187
-
188
-
189
-
190
-
191
-
192
-
193
-
194
-
195
-
196
-
197
-
198
-
199
-
200
-
201
-
202
-
203
-
204
-
205
-
206
-
207
-
208
-
209
-
210
-
211
-
212
-
213
-
214
-
215
-
216
-
217
-
218
-
219
-
220
-
221
-
222
-
223
-
224
-
225
-
226
-
227
-
228
-
229
-
230
-
231
-
232
-
233
-
234
-
235
-
236
-
237
-
238
-
239
-
240
-
241
-
242
-
243
-
244
-
245
-
246
-
247
-
248
-
249
-
250
-
251
-
252
-
253
-
254
-
255
-
256
-
257
-
258
-
259
-
260
-
261
-
262
-
263
-
264
-
265
-
266
-
267
-
268
-
269
-
270
-
271
-
272
-
273
-
274
-
275
-
276
-
277
-
278
-
279
-
280
-
281
-
282
-
283
-
284
 |
 |

Bank of America 2013 111
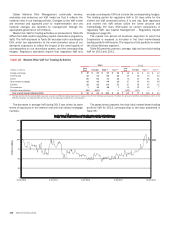
Table 70 presents derivatives utilized in our ALM activities including those designated as accounting and economic hedging
instruments and shows the notional amount, fair value, weighted-average receive-fixed and pay-fixed rates, expected maturity and
average estimated durations of our open ALM derivatives at December 31, 2013 and 2012. These amounts do not include derivative
hedges on our MSRs.
Table 70 Asset and Liability Management Interest Rate and Foreign Exchange Contracts
December 31, 2013
Expected Maturity
(Dollars in millions, average estimated duration in
years)
Fair
Value Total 2014 2015 2016 2017 2018 Thereafter
Average
Estimated
Duration
Receive-fixed interest rate swaps (1, 2) $ 5,074 4.67
Notional amount $ 109,539 $ 7,604 $ 12,873 $ 15,339 $ 19,803 $ 20,733 $ 33,187
Weighted-average fixed-rate 3.42% 3.79% 3.32%3.12%3.87%3.34%3.29%
Pay-fixed interest rate swaps (1, 2) 427 5.92
Notional amount $ 28,418 $ 4,645 $ 520 $ 1,025 $ 1,527 $ 8,529 $ 12,172
Weighted-average fixed-rate 1.87% 0.54% 2.30%1.65%1.84%1.52%2.62%
Same-currency basis swaps (3) 6
Notional amount $ 145,184 $ 47,529 $ 25,171 $ 28,157 $ 15,283 $ 9,156 $ 19,888
Foreign exchange basis swaps (2, 4, 5) 1,208
Notional amount 205,560 39,151 37,298 27,293 24,304 14,517 62,997
Option products (6) 21
Notional amount (7) (641) (649) (11) — — —19
Foreign exchange contracts (2, 5, 8) 1,619
Notional amount (7) (19,515) (35,991) 1,873 (669) 7,224 2,026 6,022
Futures and forward rate contracts 147
Notional amount (7) (19,427) (19,427) — — — ——
Net ALM contracts $ 8,502
December 31, 2012
Expected Maturity
(Dollars in millions, average estimated duration in
years)
Fair
Value Total 2013 2014 2015 2016 2017 Thereafter
Average
Estimated
Duration
Receive-fixed interest rate swaps (1, 2) $ 10,491 5.30
Notional amount $ 85,899 $ 7,175 $ 7,604 $ 11,785 $ 11,362 $ 19,693 $ 28,280
Weighted-average fixed-rate 4.12% 4.06% 3.79% 3.56% 3.98% 3.89% 4.67%
Pay-fixed interest rate swaps (1, 2) (4,903) 15.47
Notional amount $ 26,548 $ 27 $ 3,989 $ 520 $ 1,025 $ 1,527 $ 19,460
Weighted-average fixed-rate 3.09% 6.91% 0.79% 2.30% 1.65% 1.84% 3.75%
Same-currency basis swaps (3) 45
Notional amount $ 213,458 $ 82,716 $ 54,534 $ 19,995 $ 20,361 $ 13,542 $ 22,310
Foreign exchange basis swaps (2, 4, 5) 431
Notional amount 191,925 32,590 44,732 27,569 15,965 20,134 50,935
Option products (6) (147)
Notional amount (7) 4,2184,000————218
Foreign exchange contracts (2, 5, 8) 5,636
Notional amount (7) (1,200) (23,438) 8,615 1,303 582 6,183 5,555
Futures and forward rate contracts 24
Notional amount (7) (11,595)(11,595)—————
Net ALM contracts $11,577
(1) At December 31, 2013, the receive-fixed interest rate swap notional amounts that represent forward starting swaps and which will not be effective until their respective contractual start dates totaled
$600 million compared to none at December 31, 2012. The forward starting pay-fixed swap positions at December 31, 2013 and 2012 were $1.1 billion and $520 million.
(2) Does not include basis adjustments on either fixed-rate debt issued by the Corporation or AFS debt securities, which are hedged using derivatives designated as fair value hedging instruments, that
substantially offset the fair values of these derivatives.
(3) At December 31, 2013 and 2012, the notional amount of same-currency basis swaps was comprised of $145.2 billion and $213.5 billion in both foreign currency and U.S. dollar-denominated basis
swaps in which both sides of the swap are in the same currency.
(4) Foreign exchange basis swaps consisted of cross-currency variable interest rate swaps used separately or in conjunction with receive-fixed interest rate swaps.
(5) Does not include foreign currency translation adjustments on certain non-U.S. debt issued by the Corporation that substantially offset the fair values of these derivatives.
(6) The notional amount of option products of $(641) million at December 31, 2013 was comprised of $(2.0) billion in swaptions, $1.4 billion in foreign exchange options and $19 million in purchased
caps/floors. Option products of $4.2 billion at December 31, 2012 were comprised of $4.2 billion in swaptions and $18 million in purchased caps/floors.
(7) Reflects the net of long and short positions. Amounts shown as negative reflect a net short position.
(8) The notional amount of foreign exchange contracts of $(19.5) billion at December 31, 2013 was comprised of $36.1 billion in foreign currency-denominated and cross-currency receive-fixed swaps,
$(49.3) billion in net foreign currency forward rate contracts, $(10.3) billion in foreign currency-denominated pay-fixed swaps and $4.0 billion in foreign currency futures contracts. Foreign exchange
contracts of $(1.2) billion at December 31, 2012 were comprised of $41.9 billion in foreign currency-denominated and cross-currency receive-fixed swaps, $(10.5) billion in foreign currency-denominated
pay-fixed swaps and $(32.6) billion in net foreign currency forward rate contracts.