Bank of America 2013 Annual Report Download - page 29
Download and view the complete annual report
Please find page 29 of the 2013 Bank of America annual report below. You can navigate through the pages in the report by either clicking on the pages listed below, or by using the keyword search tool below to find specific information within the annual report.-
 1
1 -
2
-
3
-
4
-
5
-
6
-
7
-
8
-
9
-
10
-
11
-
12
-
13
-
14
-
15
-
16
-
17
-
18
-
 19
19 -
 20
20 -
 21
21 -
 22
22 -
 23
23 -
 24
24 -
 25
25 -
 26
26 -
 27
27 -
 28
28 -
 29
29 -
 30
30 -
 31
31 -
 32
32 -
 33
33 -
 34
34 -
 35
35 -
 36
36 -
 37
37 -
 38
38 -
 39
39 -
40
-
41
-
42
-
43
-
44
-
45
-
46
-
47
-
48
-
49
-
50
-
51
-
52
-
53
-
54
-
55
-
56
-
57
-
58
-
59
-
60
-
61
-
62
-
63
-
64
-
65
-
66
-
67
-
68
-
69
-
70
-
71
-
72
-
73
-
74
-
75
-
76
-
77
-
78
-
79
-
80
-
81
-
82
-
83
-
84
-
85
-
86
-
87
-
88
-
89
-
90
-
91
-
92
-
93
-
94
-
95
-
96
-
97
-
98
-
99
-
100
-
101
-
102
-
103
-
104
-
105
-
106
-
107
-
108
-
109
-
110
-
111
-
112
-
113
-
114
-
115
-
116
-
117
-
118
-
119
-
120
-
121
-
122
-
123
-
124
-
125
-
126
-
127
-
128
-
129
-
130
-
131
-
132
-
133
-
134
-
135
-
136
-
137
-
138
-
139
-
140
-
141
-
142
-
143
-
144
-
145
-
146
-
147
-
148
-
149
-
150
-
151
-
152
-
153
-
154
-
155
-
156
-
157
-
158
-
159
-
160
-
161
-
162
-
163
-
164
-
165
-
166
-
167
-
168
-
169
-
170
-
171
-
172
-
173
-
174
-
175
-
176
-
177
-
178
-
179
-
180
-
181
-
182
-
183
-
184
-
185
-
186
-
187
-
188
-
189
-
190
-
191
-
192
-
193
-
194
-
195
-
196
-
197
-
198
-
199
-
200
-
201
-
202
-
203
-
204
-
205
-
206
-
207
-
208
-
209
-
210
-
211
-
212
-
213
-
214
-
215
-
216
-
217
-
218
-
219
-
220
-
221
-
222
-
223
-
224
-
225
-
226
-
227
-
228
-
229
-
230
-
231
-
232
-
233
-
234
-
235
-
236
-
237
-
238
-
239
-
240
-
241
-
242
-
243
-
244
-
245
-
246
-
247
-
248
-
249
-
250
-
251
-
252
-
253
-
254
-
255
-
256
-
257
-
258
-
259
-
260
-
261
-
262
-
263
-
264
-
265
-
266
-
267
-
268
-
269
-
270
-
271
-
272
-
273
-
274
-
275
-
276
-
277
-
278
-
279
-
280
-
281
-
282
-
283
-
284
 |
 |

Bank of America 2013 27
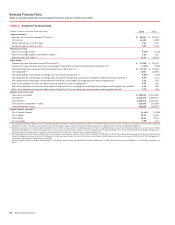
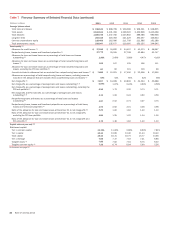
Table 7 Five-year Summary of Selected Financial Data
(In millions, except per share information) 2013 2012 2011 2010 2009
Income statement
Net interest income $ 42,265 $ 40,656 $ 44,616 $ 51,523 $ 47,109
Noninterest income 46,677 42,678 48,838 58,697 72,534
Total revenue, net of interest expense 88,942 83,334 93,454 110,220 119,643
Provision for credit losses 3,556 8,169 13,410 28,435 48,570
Goodwill impairment —— 3,184 12,400 —
Merger and restructuring charges —— 638 1,820 2,721
All other noninterest expense (1) 69,214 72,093 76,452 68,888 63,992
Income (loss) before income taxes 16,172 3,072 (230) (1,323) 4,360
Income tax expense (benefit) 4,741 (1,116) (1,676) 915 (1,916)
Net income (loss) 11,431 4,188 1,446 (2,238) 6,276
Net income (loss) applicable to common shareholders 10,082 2,760 85 (3,595) (2,204)
Average common shares issued and outstanding 10,731 10,746 10,143 9,790 7,729
Average diluted common shares issued and outstanding (2) 11,491 10,841 10,255 9,790 7,729
Performance ratios
Return on average assets 0.53%0.19% 0.06% n/m 0.26%
Return on average common shareholders’ equity 4.62 1.27 0.04 n/m n/m
Return on average tangible common shareholders’ equity (3) 6.97 1.94 0.06 n/m n/m
Return on average tangible shareholders’ equity (3) 7.13 2.60 0.96 n/m 4.18
Total ending equity to total ending assets 11.07 10.72 10.81 10.08% 10.38
Total average equity to total average assets 10.81 10.75 9.98 9.56 10.01
Dividend payout 4.25 15.86 n/m n/m n/m
Per common share data
Earnings (loss) $0.94 $ 0.26 $ 0.01 $ (0.37) $ (0.29)
Diluted earnings (loss) (2) 0.90 0.25 0.01 (0.37) (0.29)
Dividends paid 0.04 0.04 0.04 0.04 0.04
Book value 20.71 20.24 20.09 20.99 21.48
Tangible book value (3) 13.79 13.36 12.95 12.98 11.94
Market price per share of common stock
Closing $ 15.57 $ 11.61 $ 5.56 $ 13.34 $ 15.06
High closing 15.88 11.61 15.25 19.48 18.59
Low closing 11.03 5.80 4.99 10.95 3.14
Market capitalization $ 164,914 $ 125,136 $ 58,580 $ 134,536 $ 130,273
(1) Excludes merger and restructuring charges and goodwill impairment charges.
(2) Due to a net loss applicable to common shareholders for 2010 and 2009, the impact of antidilutive equity instruments was excluded from diluted earnings (loss) per share and average diluted
common shares.
(3) Tangible equity ratios and tangible book value per share of common stock are non-GAAP financial measures. Other companies may define or calculate these measures differently. For more information
on these ratios, see Supplemental Financial Data on page 29, and for corresponding reconciliations to GAAP financial measures, see Statistical Table XV on page 139.
(4) For more information on the impact of the purchased credit-impaired loan portfolio on asset quality, see Consumer Portfolio Credit Risk Management on page 73.
(5) Includes the allowance for loan and lease losses and the reserve for unfunded lending commitments.
(6) Balances and ratios do not include loans accounted for under the fair value option. For additional exclusions from nonperforming loans, leases and foreclosed properties, see Consumer Portfolio
Credit Risk Management – Nonperforming Consumer Loans, Leases and Foreclosed Properties Activity on page 85 and corresponding Table 41, and Commercial Portfolio Credit Risk Management –
Nonperforming Commercial Loans, Leases and Foreclosed Properties Activity on page 92 and corresponding Table 50.
(7) Primarily includes amounts allocated to the U.S. credit card and unsecured consumer lending portfolios in CBB, purchased credit-impaired loans and the non-U.S. credit card portfolio in All Other.
(8) Net charge-offs exclude $2.3 billion and $2.8 billion of write-offs in the purchased credit-impaired loan portfolio for 2013 and 2012. These write-offs decreased the purchased credit-impaired valuation
allowance included as part of the allowance for loan and lease losses. For more information on purchased credit-impaired write-offs, see Consumer Portfolio Credit Risk Management – Purchased
Credit-impaired Loan Portfolio on page 81.
(9) There were no write-offs of PCI loans in 2011, 2010, and 2009.
(10) Presents capital ratios in accordance with the Basel 1 – 2013 Rules, which include the Market Risk Final Rule at December 31, 2013. Basel 1 did not include the Basel 1 – 2013 Rules at December 31,
2012.
n/m = not meaningful