Bank of America 2013 Annual Report Download - page 81
Download and view the complete annual report
Please find page 81 of the 2013 Bank of America annual report below. You can navigate through the pages in the report by either clicking on the pages listed below, or by using the keyword search tool below to find specific information within the annual report.-
 1
1 -
2
-
3
-
4
-
5
-
6
-
7
-
8
-
9
-
10
-
11
-
12
-
13
-
14
-
15
-
16
-
17
-
18
-
19
-
20
-
21
-
22
-
23
-
24
-
25
-
26
-
27
-
28
-
29
-
30
-
31
-
32
-
33
-
34
-
35
-
36
-
37
-
38
-
39
-
40
-
41
-
42
-
43
-
44
-
45
-
46
-
47
-
48
-
49
-
50
-
51
-
52
-
53
-
54
-
55
-
56
-
57
-
58
-
59
-
60
-
61
-
62
-
63
-
64
-
65
-
66
-
67
-
68
-
69
-
70
-
 71
71 -
 72
72 -
 73
73 -
 74
74 -
 75
75 -
 76
76 -
 77
77 -
 78
78 -
 79
79 -
 80
80 -
 81
81 -
 82
82 -
 83
83 -
 84
84 -
 85
85 -
 86
86 -
 87
87 -
 88
88 -
 89
89 -
 90
90 -
 91
91 -
92
-
93
-
94
-
95
-
96
-
97
-
98
-
99
-
100
-
101
-
102
-
103
-
104
-
105
-
106
-
107
-
108
-
109
-
110
-
111
-
112
-
113
-
114
-
115
-
116
-
117
-
118
-
119
-
120
-
121
-
122
-
123
-
124
-
125
-
126
-
127
-
128
-
129
-
130
-
131
-
132
-
133
-
134
-
135
-
136
-
137
-
138
-
139
-
140
-
141
-
142
-
143
-
144
-
145
-
146
-
147
-
148
-
149
-
150
-
151
-
152
-
153
-
154
-
155
-
156
-
157
-
158
-
159
-
160
-
161
-
162
-
163
-
164
-
165
-
166
-
167
-
168
-
169
-
170
-
171
-
172
-
173
-
174
-
175
-
176
-
177
-
178
-
179
-
180
-
181
-
182
-
183
-
184
-
185
-
186
-
187
-
188
-
189
-
190
-
191
-
192
-
193
-
194
-
195
-
196
-
197
-
198
-
199
-
200
-
201
-
202
-
203
-
204
-
205
-
206
-
207
-
208
-
209
-
210
-
211
-
212
-
213
-
214
-
215
-
216
-
217
-
218
-
219
-
220
-
221
-
222
-
223
-
224
-
225
-
226
-
227
-
228
-
229
-
230
-
231
-
232
-
233
-
234
-
235
-
236
-
237
-
238
-
239
-
240
-
241
-
242
-
243
-
244
-
245
-
246
-
247
-
248
-
249
-
250
-
251
-
252
-
253
-
254
-
255
-
256
-
257
-
258
-
259
-
260
-
261
-
262
-
263
-
264
-
265
-
266
-
267
-
268
-
269
-
270
-
271
-
272
-
273
-
274
-
275
-
276
-
277
-
278
-
279
-
280
-
281
-
282
-
283
-
284
 |
 |

Bank of America 2013 79
Home Equity
At December 31, 2013, the home equity portfolio made up 18
percent of the consumer portfolio and is comprised of HELOCs,
home equity loans and reverse mortgages.
At December 31, 2013, our HELOC portfolio had an
outstanding balance of $80.3 billion, or 86 percent of the total
home equity portfolio compared to $91.3 billion, or 85 percent at
December 31, 2012. HELOCs generally have an initial draw period
of 10 years. During the initial draw period, the borrowers are only
required to pay the interest due on the loans on a monthly basis.
After the initial draw period ends, the loans generally convert to
15-year amortizing loans.
At December 31, 2013, our home equity loan portfolio had an
outstanding balance of $12.0 billion, or 13 percent of the total
home equity portfolio compared to $15.3 billion, or 14 percent at
December 31, 2012. Home equity loans are almost all fixed-rate
loans with amortizing payment terms of 10 to 30 years and of the
$12.0 billion at December 31, 2013, 51 percent of these loans
have 25- to 30-year terms. At both December 31, 2013 and 2012,
our reverse mortgage portfolio had an outstanding balance,
excluding loans accounted for under the fair value option, of $1.4
billion, or one percent of the total home equity portfolio. We no
longer originate these products.
At December 31, 2013, approximately 91 percent of the home
equity portfolio was included in CRES while the remainder of the
portfolio was primarily in GWIM. Outstanding balances in the home
equity portfolio, excluding loans accounted for under the fair value
option, decreased $14.5 billion in 2013 primarily due to paydowns
and charge-offs outpacing new originations and draws on existing
lines. Of the total home equity portfolio at December 31, 2013
and 2012, $23.0 billion and $24.7 billion, or 25 percent and 23
percent, were in first-lien positions (26 percent and 25 percent
excluding the PCI home equity portfolio). At December 31, 2013,
outstanding balances in the home equity portfolio that were in a
second-lien or more junior-lien position and where we also held
the first-lien loan totaled $17.6 billion, or 20 percent of our total
home equity portfolio excluding the PCI loan portfolio.
Unused HELOCs totaled $56.8 billion and $60.9 billion at
December 31, 2013 and 2012. This decrease was primarily due
to customers choosing to close accounts, which more than offset
customer paydowns of principal balances as well as the impact of
new production. The HELOC utilization rate was 59 percent at
December 31, 2013 compared to 60 percent at December 31,
2012.
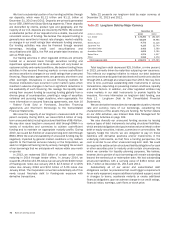
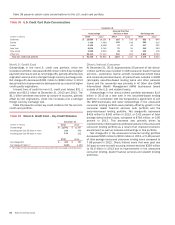
Table 32 presents certain home equity portfolio key credit
statistics on both a reported basis excluding loans accounted for
under the fair value option, and excluding the PCI loan portfolio.
Additionally, in the “Reported Basis” columns in the table below,
accruing balances past due 30 days or more and nonperforming
loans do not include the PCI loan portfolio, in accordance with our
accounting policies, even though the customer may be
contractually past due. As such, the following discussion presents
the home equity portfolio excluding the PCI loan portfolio and loans
accounted for under the fair value option. For more information on
the PCI loan portfolio, see page 81.
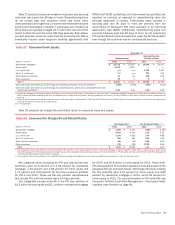
Table 32 Home Equity – Key Credit Statistics
December 31
Reported Basis (1)
Excluding Purchased
Credit-impaired Loans
(Dollars in millions) 2013 2012 2013 2012
Outstandings $ 93,672 $ 108,140 $87,079 $ 99,473
Accruing past due 30 days or more (2) 901 1,099 901 1,099
Nonperforming loans (2) 4,075 4,282 4,075 4,282
Percent of portfolio
Refreshed combined LTV greater than 90 but less than or equal to 100 9% 10% 9% 10%
Refreshed combined LTV greater than 100 22 31 19 29
Refreshed FICO below 620 8988
2006 and 2007 vintages (3) 48 48 45 46
Net charge-off ratio (4) 1.80 3.62 1.94 3.99
(1) Outstandings, accruing past due, nonperforming loans and percentages of portfolio exclude loans accounted for under the fair value option. There were $147 million of home equity loans accounted
for under the fair value option at December 31, 2013 compared to none at December 31, 2012. For more information on the fair value option, see Consumer Portfolio Credit Risk Management –
Consumer Loans Accounted for Under the Fair Value Option on page 85 and Note 21 – Fair Value Option to the Consolidated Financial Statements.
(2) Accruing past due 30 days or more includes $164 million and $321 million and nonperforming loans includes $410 million and $824 million of loans where we serviced the underlying first-lien at
December 31, 2013 and 2012.
(3) These vintages of loans have higher refreshed combined LTV ratios and accounted for 50 percent and 51 percent of nonperforming home equity loans at December 31, 2013 and 2012, and accounted
for 63 percent and 60 percent of net charge-offs in 2013 and 2012.
(4) Net charge-off ratios are calculated as net charge-offs divided by average outstanding loans excluding loans accounted for under the fair value option.
Nonperforming outstanding balances in the home equity
portfolio decreased $207 million in 2013 due to charge-offs and
returns to performing status outpacing new inflows.
At December 31, 2013, on $2.0 billion, or 48 percent of
nonperforming home equity loans, the borrowers were current on
contractual payments. At December 31, 2013, $1.4 billion, or 35
percent of nonperforming home equity loans were 180 days or
more past due and had been written down to the estimated fair
value of the collateral less costs to sell. Outstanding balances
accruing past due 30 days or more decreased $198 million in
2013.
In some cases, the junior-lien home equity outstanding balance
that we hold is performing, but the underlying first-lien is not. For
outstanding balances in the home equity portfolio on which we
service the first-lien loan, we are able to track whether the first-
lien loan is in default. For loans where the first-lien is serviced by
a third party, we utilize credit bureau data to estimate the
delinquency status of the first-lien. Given that the credit bureau
database we use does not include a property address for the
mortgages, we are unable to identify with certainty whether a
reported delinquent first-lien mortgage pertains to the same
property for which we hold a junior-lien loan. At December 31,
2013, we estimate that $2.1 billion of current and $382 million