Bank of America 2013 Annual Report Download - page 210
Download and view the complete annual report
Please find page 210 of the 2013 Bank of America annual report below. You can navigate through the pages in the report by either clicking on the pages listed below, or by using the keyword search tool below to find specific information within the annual report.-
 1
1 -
2
-
3
-
4
-
5
-
6
-
7
-
8
-
9
-
10
-
11
-
12
-
13
-
14
-
15
-
16
-
17
-
18
-
19
-
20
-
21
-
22
-
23
-
24
-
25
-
26
-
27
-
28
-
29
-
30
-
31
-
32
-
33
-
34
-
35
-
36
-
37
-
38
-
39
-
40
-
41
-
42
-
43
-
44
-
45
-
46
-
47
-
48
-
49
-
50
-
51
-
52
-
53
-
54
-
55
-
56
-
57
-
58
-
59
-
60
-
61
-
62
-
63
-
64
-
65
-
66
-
67
-
68
-
69
-
70
-
71
-
72
-
73
-
74
-
75
-
76
-
77
-
78
-
79
-
80
-
81
-
82
-
83
-
84
-
85
-
86
-
87
-
88
-
89
-
90
-
91
-
92
-
93
-
94
-
95
-
96
-
97
-
98
-
99
-
100
-
101
-
102
-
103
-
104
-
105
-
106
-
107
-
108
-
109
-
110
-
111
-
112
-
113
-
114
-
115
-
116
-
117
-
118
-
119
-
120
-
121
-
122
-
123
-
124
-
125
-
126
-
127
-
128
-
129
-
130
-
131
-
132
-
133
-
134
-
135
-
136
-
137
-
138
-
139
-
140
-
141
-
142
-
143
-
144
-
145
-
146
-
147
-
148
-
149
-
150
-
151
-
152
-
153
-
154
-
155
-
156
-
157
-
158
-
159
-
160
-
161
-
162
-
163
-
164
-
165
-
166
-
167
-
168
-
169
-
170
-
171
-
172
-
173
-
174
-
175
-
176
-
177
-
178
-
179
-
180
-
181
-
182
-
183
-
184
-
185
-
186
-
187
-
188
-
189
-
190
-
191
-
192
-
193
-
194
-
195
-
196
-
197
-
198
-
199
-
 200
200 -
 201
201 -
 202
202 -
 203
203 -
 204
204 -
 205
205 -
 206
206 -
 207
207 -
 208
208 -
 209
209 -
 210
210 -
 211
211 -
 212
212 -
 213
213 -
 214
214 -
 215
215 -
 216
216 -
 217
217 -
 218
218 -
 219
219 -
 220
220 -
221
-
222
-
223
-
224
-
225
-
226
-
227
-
228
-
229
-
230
-
231
-
232
-
233
-
234
-
235
-
236
-
237
-
238
-
239
-
240
-
241
-
242
-
243
-
244
-
245
-
246
-
247
-
248
-
249
-
250
-
251
-
252
-
253
-
254
-
255
-
256
-
257
-
258
-
259
-
260
-
261
-
262
-
263
-
264
-
265
-
266
-
267
-
268
-
269
-
270
-
271
-
272
-
273
-
274
-
275
-
276
-
277
-
278
-
279
-
280
-
281
-
282
-
283
-
284
 |
 |

208 Bank of America 2013
Additional factors that impact the non-GSE representations and
warranties liability and the portion of the estimated range of
possible loss corresponding to non-GSE representations and
warranties exposures include: (1) contractual material adverse
effect requirements, (2) the representations and warranties
provided, and (3) the requirement to meet certain presentation
thresholds. The first factor is based on the Corporation’s belief
that a non-GSE contractual liability to repurchase a loan generally
arises only if the counterparties prove there is a breach of
representations and warranties that materially and adversely
affects the interest of the investor or all investors, or of the
monoline insurer or other financial guarantor (as applicable), in a
securitization trust and, accordingly, the Corporation believes that
the repurchase claimants must prove that the alleged
representations and warranties breach was the cause of the loss.
The second factor is based on the differences in the types of
representations and warranties given in non-GSE securitizations
from those provided to the GSEs. The Corporation believes the
non-GSE securitizations’ representations and warranties are less
rigorous and actionable than the explicit provisions of comparable
agreements with the GSEs without regard to any variations that
may have arisen as a result of dealings with the GSEs. The third
factor is related to certain presentation thresholds that need to
be met in order for any repurchase claim to be asserted on the
initiative of investors under the non-GSE agreements. A
securitization trustee may investigate or demand repurchase on
its own action, and most agreements contain a presentation
threshold, for example 25 percent of the voting rights per trust,
that allows investors to declare a servicing event of default under
certain circumstances or to request certain action, such as
requesting loan files, that the trustee may choose to accept and
follow, exempt from liability, provided the trustee is acting in good
faith. If there is an uncured servicing event of default and the
trustee fails to bring suit during a 60-day period, then, under most
agreements, investors may file suit. In addition to this, most
agreements also allow investors to direct the securitization trustee
to investigate loan files or demand the repurchase of loans if
security holders hold a specified percentage, for example, 25
percent, of the voting rights of each tranche of the outstanding
securities. Although the Corporation continues to believe that
presentation thresholds are a factor in the determination of
probable loss, given the BNY Mellon Settlement, the estimated
range of possible loss assumes that the presentation threshold
can be met for all of the non-GSE securitization transactions. The
population of private-label securitizations included in the BNY
Mellon Settlement encompasses almost all Countrywide first-lien
private-label securitizations including loans originated principally
between 2004 and 2008. For the remainder of the population of
private-label securitizations, other claimants have come forward
and the Corporation believes it is probable that other claimants
in certain types of securitizations may continue to come forward
with claims that meet the requirements of the terms of the
securitizations. See Estimated Range of Possible Loss in this Note
for additional discussion of the representations and warranties
liability and the corresponding estimated range of possible loss.
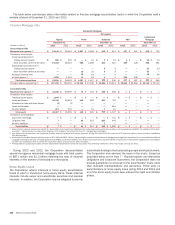
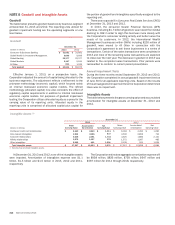
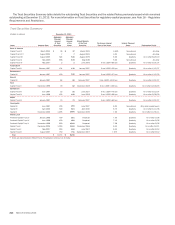
The table below presents a rollforward of the liability for
representations and warranties and corporate guarantees.
Representations and Warranties and Corporate
Guarantees
(Dollars in millions) 2013 2012
Liability for representations and warranties and
corporate guarantees, January 1 $ 19,021 $ 15,858
Additions for new sales 36 28
Net reductions (6,615) (804)
Provision 840 3,939
Liability for representations and warranties and
corporate guarantees, December 31 $ 13,282 $ 19,021
For 2013, the provision for representations and warranties and
corporate guarantees was $840 million compared to $3.9 billion
for 2012. The provision in 2012 included $2.5 billion in provision
related to the FNMA Settlement and $500 million for obligations
to FNMA related to MI rescissions.
The representations and warranties liability represents the
Corporation’s best estimate of probable incurred losses as of
December 31, 2013. However, it is reasonably possible that future
representations and warranties losses may occur in excess of the
amounts recorded for these exposures. Although the Corporation
has not recorded any representations and warranties liability for
certain potential private-label securitization and whole-loan
exposures where it has had little to no claim activity, these
exposures are included in the estimated range of possible loss.
Government-sponsored Enterprises Experience
The various settlements with the GSEs have resolved substantially
all outstanding and potential mortgage repurchase and make-
whole claims relating to the origination, sale and delivery of
residential mortgage loans that were sold directly to FNMA through
December 31, 2008 and to FHLMC through December 31, 2009,
subject to certain exclusions, which the Corporation does not
believe are material.