Bank of America 2013 Annual Report Download - page 177
Download and view the complete annual report
Please find page 177 of the 2013 Bank of America annual report below. You can navigate through the pages in the report by either clicking on the pages listed below, or by using the keyword search tool below to find specific information within the annual report.-
 1
1 -
2
-
3
-
4
-
5
-
6
-
7
-
8
-
9
-
10
-
11
-
12
-
13
-
14
-
15
-
16
-
17
-
18
-
19
-
20
-
21
-
22
-
23
-
24
-
25
-
26
-
27
-
28
-
29
-
30
-
31
-
32
-
33
-
34
-
35
-
36
-
37
-
38
-
39
-
40
-
41
-
42
-
43
-
44
-
45
-
46
-
47
-
48
-
49
-
50
-
51
-
52
-
53
-
54
-
55
-
56
-
57
-
58
-
59
-
60
-
61
-
62
-
63
-
64
-
65
-
66
-
67
-
68
-
69
-
70
-
71
-
72
-
73
-
74
-
75
-
76
-
77
-
78
-
79
-
80
-
81
-
82
-
83
-
84
-
85
-
86
-
87
-
88
-
89
-
90
-
91
-
92
-
93
-
94
-
95
-
96
-
97
-
98
-
99
-
100
-
101
-
102
-
103
-
104
-
105
-
106
-
107
-
108
-
109
-
110
-
111
-
112
-
113
-
114
-
115
-
116
-
117
-
118
-
119
-
120
-
121
-
122
-
123
-
124
-
125
-
126
-
127
-
128
-
129
-
130
-
131
-
132
-
133
-
134
-
135
-
136
-
137
-
138
-
139
-
140
-
141
-
142
-
143
-
144
-
145
-
146
-
147
-
148
-
149
-
150
-
151
-
152
-
153
-
154
-
155
-
156
-
157
-
158
-
159
-
160
-
161
-
162
-
163
-
164
-
165
-
166
-
 167
167 -
 168
168 -
 169
169 -
 170
170 -
 171
171 -
 172
172 -
 173
173 -
 174
174 -
 175
175 -
 176
176 -
 177
177 -
 178
178 -
 179
179 -
 180
180 -
 181
181 -
 182
182 -
 183
183 -
 184
184 -
 185
185 -
 186
186 -
 187
187 -
188
-
189
-
190
-
191
-
192
-
193
-
194
-
195
-
196
-
197
-
198
-
199
-
200
-
201
-
202
-
203
-
204
-
205
-
206
-
207
-
208
-
209
-
210
-
211
-
212
-
213
-
214
-
215
-
216
-
217
-
218
-
219
-
220
-
221
-
222
-
223
-
224
-
225
-
226
-
227
-
228
-
229
-
230
-
231
-
232
-
233
-
234
-
235
-
236
-
237
-
238
-
239
-
240
-
241
-
242
-
243
-
244
-
245
-
246
-
247
-
248
-
249
-
250
-
251
-
252
-
253
-
254
-
255
-
256
-
257
-
258
-
259
-
260
-
261
-
262
-
263
-
264
-
265
-
266
-
267
-
268
-
269
-
270
-
271
-
272
-
273
-
274
-
275
-
276
-
277
-
278
-
279
-
280
-
281
-
282
-
283
-
284
 |
 |

Bank of America 2013 175
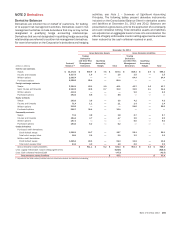
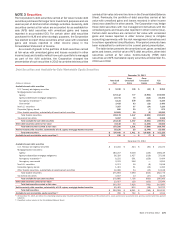
NOTE 3 Securities
The Corporation’s debt securities carried at fair value include debt
securities purchased for longer term investment purposes and are
used as part of ALM and other strategic activities. Generally, debt
securities carried at fair value are accounted for as available-for-
sale (AFS) debt securities with unrealized gains and losses
reported in accumulated OCI. For certain other debt securities
purchased for ALM and other strategic purposes, the Corporation
has elected to report those securities at fair value with unrealized
gains and losses reported in other income (loss) in the
Consolidated Statement of Income.
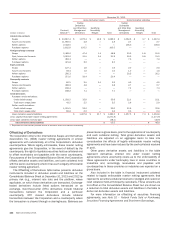
As a result of growth in the portfolio of debt securities carried
at fair value with unrealized gains and losses recorded in other
income (loss) and to better reflect how such a portfolio is managed
as part of the ALM activities, the Corporation changed the
presentation of such securities in 2013 to combine debt securities
carried at fair value into one line item on the Consolidated Balance
Sheet. Previously, the portfolio of debt securities carried at fair
value with unrealized gains and losses recorded in other income
(loss) was classified in other assets. The Corporation may hedge
these debt securities with risk management derivatives with the
unrealized gains and losses also reported in other income (loss).
Certain debt securities are carried at fair value with unrealized
gains and losses reported in other income (loss) to mitigate
accounting asymmetry with the risk management derivatives and
to achieve operational simplifications. Prior-period amounts have
been reclassified to conform to the current period presentation.
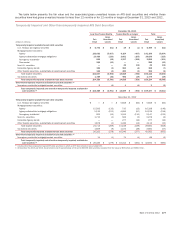
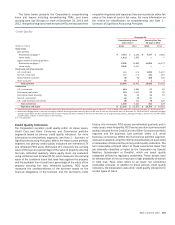
The table below presents the amortized cost, gross unrealized
gains and losses, and fair value of AFS debt securities, other debt
securities carried at fair value, held-to-maturity (HTM) debt
securities and AFS marketable equity securities at December 31,
2013 and 2012.
Debt Securities and Available-for-Sale Marketable Equity Securities
December 31, 2013
(Dollars in millions)
Amortized
Cost
Gross
Unrealized
Gains
Gross
Unrealized
Losses
Fair
Value
Available-for-sale debt securities
U.S. Treasury and agency securities $ 8,910 $ 106 $ (62) $ 8,954
Mortgage-backed securities:
Agency 170,112 777 (5,954) 164,935
Agency-collateralized mortgage obligations 22,731 76 (315) 22,492
Non-agency residential (1) 6,124 238 (123) 6,239
Commercial 2,429 63 (12) 2,480
Non-U.S. securities 7,207 37 (24) 7,220
Corporate/Agency bonds 860 20 (7) 873
Other taxable securities, substantially all asset-backed securities 16,805 30 (5) 16,830
Total taxable securities 235,178 1,347 (6,502) 230,023
Tax-exempt securities 5,967 10 (49) 5,928
Total available-for-sale debt securities 241,145 1,357 (6,551) 235,951
Other debt securities carried at fair value 34,145 34 (1,335) 32,844
Total debt securities carried at fair value 275,290 1,391 (7,886) 268,795
Held-to-maturity debt securities, substantially all U.S. agency mortgage-backed securities 55,150 20 (2,740) 52,430
Total debt securities $ 330,440 $ 1,411 $ (10,626) $ 321,225
Available-for-sale marketable equity securities (2) $230 $—$(7) $ 223
December 31, 2012
Available-for-sale debt securities
U.S. Treasury and agency securities $ 24,232 $ 324 $ (84) $ 24,472
Mortgage-backed securities:
Agency 183,247 5,048 (146) 188,149
Agency-collateralized mortgage obligations 36,329 1,427 (218) 37,538
Non-agency residential (1) 9,231 391 (128) 9,494
Non-agency commercial 3,576 348 — 3,924
Non-U.S. securities 5,574 50 (6) 5,618
Corporate/Agency bonds 1,415 51 (16) 1,450
Other taxable securities, substantially all asset-backed securities 12,089 54 (15) 12,128
Total taxable securities 275,693 7,693 (613) 282,773
Tax-exempt securities 4,167 13 (47) 4,133
Total available-for-sale debt securities 279,860 7,706 (660) 286,906
Other debt securities carried at fair value 23,927 120 (103) 23,944
Total debt securities carried at fair value 303,787 7,826 (763) 310,850
Held-to-maturity debt securities, substantially all U.S. agency mortgage-backed securities 49,481 815 (26) 50,270
Total debt securities $ 353,268 $ 8,641 $ (789) $ 361,120
Available-for-sale marketable equity securities (2) $ 780 $ 732 $ — $ 1,512
(1) At December 31, 2013 and 2012, the underlying collateral type included approximately 89 percent and 91 percent prime, seven percent and six percent Alt-A, and four percent and three percent
subprime.
(2) Classified in other assets on the Consolidated Balance Sheet.