Bank of America 2013 Annual Report Download - page 277
Download and view the complete annual report
Please find page 277 of the 2013 Bank of America annual report below. You can navigate through the pages in the report by either clicking on the pages listed below, or by using the keyword search tool below to find specific information within the annual report.-
 1
1 -
2
-
3
-
4
-
5
-
6
-
7
-
8
-
9
-
10
-
11
-
12
-
13
-
14
-
15
-
16
-
17
-
18
-
19
-
20
-
21
-
22
-
23
-
24
-
25
-
26
-
27
-
28
-
29
-
30
-
31
-
32
-
33
-
34
-
35
-
36
-
37
-
38
-
39
-
40
-
41
-
42
-
43
-
44
-
45
-
46
-
47
-
48
-
49
-
50
-
51
-
52
-
53
-
54
-
55
-
56
-
57
-
58
-
59
-
60
-
61
-
62
-
63
-
64
-
65
-
66
-
67
-
68
-
69
-
70
-
71
-
72
-
73
-
74
-
75
-
76
-
77
-
78
-
79
-
80
-
81
-
82
-
83
-
84
-
85
-
86
-
87
-
88
-
89
-
90
-
91
-
92
-
93
-
94
-
95
-
96
-
97
-
98
-
99
-
100
-
101
-
102
-
103
-
104
-
105
-
106
-
107
-
108
-
109
-
110
-
111
-
112
-
113
-
114
-
115
-
116
-
117
-
118
-
119
-
120
-
121
-
122
-
123
-
124
-
125
-
126
-
127
-
128
-
129
-
130
-
131
-
132
-
133
-
134
-
135
-
136
-
137
-
138
-
139
-
140
-
141
-
142
-
143
-
144
-
145
-
146
-
147
-
148
-
149
-
150
-
151
-
152
-
153
-
154
-
155
-
156
-
157
-
158
-
159
-
160
-
161
-
162
-
163
-
164
-
165
-
166
-
167
-
168
-
169
-
170
-
171
-
172
-
173
-
174
-
175
-
176
-
177
-
178
-
179
-
180
-
181
-
182
-
183
-
184
-
185
-
186
-
187
-
188
-
189
-
190
-
191
-
192
-
193
-
194
-
195
-
196
-
197
-
198
-
199
-
200
-
201
-
202
-
203
-
204
-
205
-
206
-
207
-
208
-
209
-
210
-
211
-
212
-
213
-
214
-
215
-
216
-
217
-
218
-
219
-
220
-
221
-
222
-
223
-
224
-
225
-
226
-
227
-
228
-
229
-
230
-
231
-
232
-
233
-
234
-
235
-
236
-
237
-
238
-
239
-
240
-
241
-
242
-
243
-
244
-
245
-
246
-
247
-
248
-
249
-
250
-
251
-
252
-
253
-
254
-
255
-
256
-
257
-
258
-
259
-
260
-
261
-
262
-
263
-
264
-
265
-
266
-
 267
267 -
 268
268 -
 269
269 -
 270
270 -
 271
271 -
 272
272 -
 273
273 -
 274
274 -
 275
275 -
 276
276 -
 277
277 -
 278
278 -
 279
279 -
 280
280 -
 281
281 -
 282
282 -
 283
283 -
 284
284
 |
 |

Bank of America 2013 275
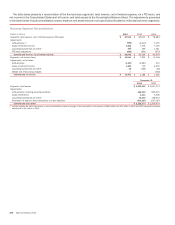
NOTE 25 Parent Company Information
The following tables present the Parent Company-only financial information. On October 1, 2013, the merger of Merrill Lynch & Co.,
Inc. into Bank of America Corporation was completed; however, the Parent Company-only financial information is presented in accordance
with bank regulatory reporting requirements and as such prior periods have not been restated.
Condensed Statement of Income
(Dollars in millions) 2013 2012 2011
Income
Dividends from subsidiaries:
Bank holding companies and related subsidiaries $ 8,532 $ 16,213 $ 10,277
Nonbank companies and related subsidiaries 357 542 553
Interest from subsidiaries 2,087 627 869
Other income (loss) (1) 233 (304) 10,603
Total income 11,209 17,078 22,302
Expense
Interest on borrowed funds 6,379 5,376 6,234
Noninterest expense (2) 12,668 11,643 11,861
Total expense 19,047 17,019 18,095
Income (loss) before income taxes and equity in undistributed earnings of subsidiaries (7,838)59 4,207
Income tax benefit (7,227)(5,883) (2,783)
Income (loss) before equity in undistributed earnings of subsidiaries (611)5,942 6,990
Equity in undistributed earnings (losses) of subsidiaries:
Bank holding companies and related subsidiaries 14,150 1,072 6,650
Nonbank companies and related subsidiaries (2,108)(2,826) (12,194)
Total equity in undistributed earnings (losses) of subsidiaries 12,042 (1,754) (5,544)
Net income $ 11,431 $ 4,188 $ 1,446
Net income applicable to common shareholders $ 10,082 $ 2,760 $ 85
(1) Includes $753 million and $6.5 billion of gains related to the sale of the Corporation’s investment in CCB in 2013 and 2011.
(2) Includes, in aggregate, $1.3 billion, $4.1 billion and $6.9 billion in 2013, 2012 and 2011 of representations and warranties provision, which is presented as a component of mortgage banking
income on the Consolidated Statement of Income, litigation expense and in 2012 an expense related to an agreement with the Federal Reserve and the OCC to cease the Independent Foreclosure
Review and replace it with an accelerated remediation process.
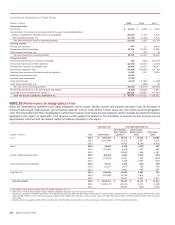
Condensed Balance Sheet
December 31
(Dollars in millions) 2013 2012
Assets
Cash held at bank subsidiaries $98,679 $ 101,831
Securities 747 1,959
Receivables from subsidiaries:
Bank holding companies and related subsidiaries 23,558 33,481
Banks and related subsidiaries 1,682 —
Nonbank companies and related subsidiaries 46,577 3,861
Investments in subsidiaries:
Bank holding companies and related subsidiaries 268,234 185,803
Nonbank companies and related subsidiaries 1,818 65,300
Other assets 19,073 15,208
Total assets $ 460,368 $ 407,443
Liabilities and shareholders’ equity
Short-term borrowings $181 $ 100
Accrued expenses and other liabilities 15,428 34,364
Payables to subsidiaries:
Bank holding companies and related subsidiaries —1,396
Banks and related subsidiaries 1,991 —
Nonbank companies and related subsidiaries 15,980 688
Long-term debt 194,103 133,939
Total liabilities 227,683 170,487
Shareholders’ equity 232,685 236,956
Total liabilities and shareholders’ equity $ 460,368 $ 407,443