Bank of America 2013 Annual Report Download - page 96
Download and view the complete annual report
Please find page 96 of the 2013 Bank of America annual report below. You can navigate through the pages in the report by either clicking on the pages listed below, or by using the keyword search tool below to find specific information within the annual report.-
 1
1 -
2
-
3
-
4
-
5
-
6
-
7
-
8
-
9
-
10
-
11
-
12
-
13
-
14
-
15
-
16
-
17
-
18
-
19
-
20
-
21
-
22
-
23
-
24
-
25
-
26
-
27
-
28
-
29
-
30
-
31
-
32
-
33
-
34
-
35
-
36
-
37
-
38
-
39
-
40
-
41
-
42
-
43
-
44
-
45
-
46
-
47
-
48
-
49
-
50
-
51
-
52
-
53
-
54
-
55
-
56
-
57
-
58
-
59
-
60
-
61
-
62
-
63
-
64
-
65
-
66
-
67
-
68
-
69
-
70
-
71
-
72
-
73
-
74
-
75
-
76
-
77
-
78
-
79
-
80
-
81
-
82
-
83
-
84
-
85
-
 86
86 -
 87
87 -
 88
88 -
 89
89 -
 90
90 -
 91
91 -
 92
92 -
 93
93 -
 94
94 -
 95
95 -
 96
96 -
 97
97 -
 98
98 -
 99
99 -
 100
100 -
 101
101 -
 102
102 -
 103
103 -
 104
104 -
 105
105 -
 106
106 -
107
-
108
-
109
-
110
-
111
-
112
-
113
-
114
-
115
-
116
-
117
-
118
-
119
-
120
-
121
-
122
-
123
-
124
-
125
-
126
-
127
-
128
-
129
-
130
-
131
-
132
-
133
-
134
-
135
-
136
-
137
-
138
-
139
-
140
-
141
-
142
-
143
-
144
-
145
-
146
-
147
-
148
-
149
-
150
-
151
-
152
-
153
-
154
-
155
-
156
-
157
-
158
-
159
-
160
-
161
-
162
-
163
-
164
-
165
-
166
-
167
-
168
-
169
-
170
-
171
-
172
-
173
-
174
-
175
-
176
-
177
-
178
-
179
-
180
-
181
-
182
-
183
-
184
-
185
-
186
-
187
-
188
-
189
-
190
-
191
-
192
-
193
-
194
-
195
-
196
-
197
-
198
-
199
-
200
-
201
-
202
-
203
-
204
-
205
-
206
-
207
-
208
-
209
-
210
-
211
-
212
-
213
-
214
-
215
-
216
-
217
-
218
-
219
-
220
-
221
-
222
-
223
-
224
-
225
-
226
-
227
-
228
-
229
-
230
-
231
-
232
-
233
-
234
-
235
-
236
-
237
-
238
-
239
-
240
-
241
-
242
-
243
-
244
-
245
-
246
-
247
-
248
-
249
-
250
-
251
-
252
-
253
-
254
-
255
-
256
-
257
-
258
-
259
-
260
-
261
-
262
-
263
-
264
-
265
-
266
-
267
-
268
-
269
-
270
-
271
-
272
-
273
-
274
-
275
-
276
-
277
-
278
-
279
-
280
-
281
-
282
-
283
-
284
 |
 |

94 Bank of America 2013
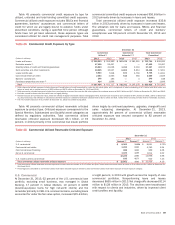
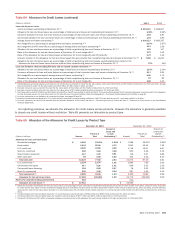
total real estate industry committed exposure at December 31,
2013 and 2012. For more information on commercial real estate
and related portfolios, see Commercial Portfolio Credit Risk
Management – Commercial Real Estate on page 90.
Retailing, our third largest industry concentration, experienced
an increase in committed exposure of $6.9 billion, or 14 percent,
in 2013 driven by loans to auto dealers and wholesalers, apparel
retail, and specialty stores. Committed exposure to the food,
beverage and tobacco industry decreased $6.8 billion, or 18
percent, in 2013, primarily related to commitment reductions and
paydowns. Capital goods committed exposure increased $3.7
billion, or seven percent, in 2013 driven by heavy electrical
equipment and machinery exposure. Healthcare equipment and
services committed exposure increased $3.6 billion, or eight
percent, in 2013 driven by health care distributors, doctors,
dentists and practitioners, and health care equipment. Energy
committed exposure increased $2.7 billion, or seven percent, in
2013 reflecting higher exposure to the integrated oil and gas, and
exploration and production sectors.
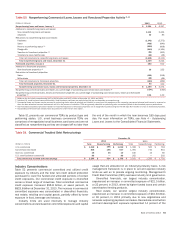
Our committed state and municipal exposure of $35.9 billion
at December 31, 2013 consisted of $29.4 billion of commercial
utilized exposure (including $18.6 billion of funded loans, $7.3
billion of SBLCs and $1.7 billion of derivative assets) and $6.5
billion of unfunded commercial exposure (primarily unfunded loan
commitments and letters of credit) and is reported in the
government and public education industry in Table 52. While the
slow pace of economic recovery continues to pressure budgets,
most state and local governments have implemented offsetting
fiscal adjustments and continue to honor debt obligations as
agreed. While historical default rates have been low, as part of
our overall and ongoing risk management processes, we
continually monitor these exposures through a rigorous review
process. Additionally, internal communications are regularly
circulated such that exposure levels are maintained in compliance
with established concentration guidelines.
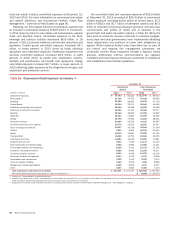
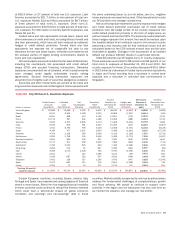
Table 52 Commercial Credit Exposure by Industry (1)
December 31
Commercial
Utilized
Total Commercial
Committed
(Dollars in millions) 2013 2012 2013 2012
Diversified financials $ 78,423 $ 66,102 $ 121,075 $ 99,574
Real estate (2) 54,336 47,479 76,418 65,639
Retailing 32,859 28,065 54,616 47,719
Capital goods 28,016 25,071 52,849 49,196
Healthcare equipment and services 30,828 29,396 49,063 45,488
Government and public education 40,253 41,441 48,322 50,277
Banking 39,649 39,829 45,095 44,822
Materials 22,384 21,809 42,699 40,493
Energy 19,739 17,661 41,156 38,441
Consumer services 21,080 23,093 34,217 36,367
Commercial services and supplies 19,770 19,020 32,007 30,257
Food, beverage and tobacco 14,437 14,738 30,541 37,344
Utilities 9,253 8,403 25,243 23,425
Media 13,070 13,091 22,655 21,705
Transportation 15,280 13,791 22,595 20,255
Individuals and trusts 14,864 13,916 18,681 17,801
Software and services 6,814 5,549 14,172 12,125
Pharmaceuticals and biotechnology 6,455 3,846 13,986 11,401
Technology hardware and equipment 6,166 5,111 12,733 11,101
Insurance, including monolines 5,926 8,491 12,203 14,117
Telecommunication services 4,541 4,008 11,423 10,276
Consumer durables and apparel 5,427 4,246 9,757 8,438
Automobiles and components 3,165 3,312 8,424 7,675
Food and staples retailing 3,950 3,528 7,909 6,838
Religious and social organizations 5,452 6,850 7,677 9,107
Other 5,357 3,881 8,309 7,124
Total commercial credit exposure by industry $ 507,494 $471,727 $ 823,825 $ 767,005
Net credit default protection purchased on total commitments (3) $(8,085)$ (14,657)
(1) Includes U.S. small business commercial exposure.
(2) Industries are viewed from a variety of perspectives to best isolate the perceived risks. For purposes of this table, the real estate industry is defined based on the borrowers’ or counterparties’
primary business activity using operating cash flows and primary source of repayment as key factors.
(3) Represents net notional credit protection purchased. For additional information, see Commercial Portfolio Credit Risk Management – Risk Mitigation on page 95.