Bank of America 2013 Annual Report Download - page 76
Download and view the complete annual report
Please find page 76 of the 2013 Bank of America annual report below. You can navigate through the pages in the report by either clicking on the pages listed below, or by using the keyword search tool below to find specific information within the annual report.-
 1
1 -
2
-
3
-
4
-
5
-
6
-
7
-
8
-
9
-
10
-
11
-
12
-
13
-
14
-
15
-
16
-
17
-
18
-
19
-
20
-
21
-
22
-
23
-
24
-
25
-
26
-
27
-
28
-
29
-
30
-
31
-
32
-
33
-
34
-
35
-
36
-
37
-
38
-
39
-
40
-
41
-
42
-
43
-
44
-
45
-
46
-
47
-
48
-
49
-
50
-
51
-
52
-
53
-
54
-
55
-
56
-
57
-
58
-
59
-
60
-
61
-
62
-
63
-
64
-
65
-
 66
66 -
 67
67 -
 68
68 -
 69
69 -
 70
70 -
 71
71 -
 72
72 -
 73
73 -
 74
74 -
 75
75 -
 76
76 -
 77
77 -
 78
78 -
 79
79 -
 80
80 -
 81
81 -
 82
82 -
 83
83 -
 84
84 -
 85
85 -
 86
86 -
87
-
88
-
89
-
90
-
91
-
92
-
93
-
94
-
95
-
96
-
97
-
98
-
99
-
100
-
101
-
102
-
103
-
104
-
105
-
106
-
107
-
108
-
109
-
110
-
111
-
112
-
113
-
114
-
115
-
116
-
117
-
118
-
119
-
120
-
121
-
122
-
123
-
124
-
125
-
126
-
127
-
128
-
129
-
130
-
131
-
132
-
133
-
134
-
135
-
136
-
137
-
138
-
139
-
140
-
141
-
142
-
143
-
144
-
145
-
146
-
147
-
148
-
149
-
150
-
151
-
152
-
153
-
154
-
155
-
156
-
157
-
158
-
159
-
160
-
161
-
162
-
163
-
164
-
165
-
166
-
167
-
168
-
169
-
170
-
171
-
172
-
173
-
174
-
175
-
176
-
177
-
178
-
179
-
180
-
181
-
182
-
183
-
184
-
185
-
186
-
187
-
188
-
189
-
190
-
191
-
192
-
193
-
194
-
195
-
196
-
197
-
198
-
199
-
200
-
201
-
202
-
203
-
204
-
205
-
206
-
207
-
208
-
209
-
210
-
211
-
212
-
213
-
214
-
215
-
216
-
217
-
218
-
219
-
220
-
221
-
222
-
223
-
224
-
225
-
226
-
227
-
228
-
229
-
230
-
231
-
232
-
233
-
234
-
235
-
236
-
237
-
238
-
239
-
240
-
241
-
242
-
243
-
244
-
245
-
246
-
247
-
248
-
249
-
250
-
251
-
252
-
253
-
254
-
255
-
256
-
257
-
258
-
259
-
260
-
261
-
262
-
263
-
264
-
265
-
266
-
267
-
268
-
269
-
270
-
271
-
272
-
273
-
274
-
275
-
276
-
277
-
278
-
279
-
280
-
281
-
282
-
283
-
284
 |
 |

74 Bank of America 2013
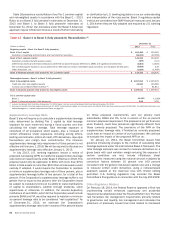
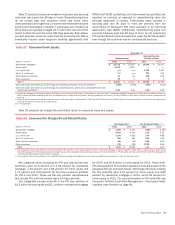
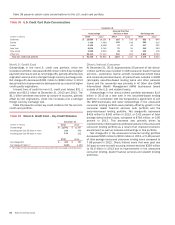
Table 26 presents our outstanding consumer loans and leases,
and the PCI loan portfolio. In addition to being included in the
“Outstandings” columns in Table 26, PCI loans are also shown
separately, net of purchase accounting adjustments, in the
“Purchased Credit-impaired Loan Portfolio” columns. The impact
of the PCI loan portfolio on certain credit statistics is reported
where appropriate. Given the continued run-off of our discontinued
real estate portfolio, effective January 1, 2013, pay option loans
are included as part of our residential mortgage and home equity
portfolios. The majority of these loans were considered credit-
impaired and were written down to fair value upon acquisition. Prior
periods were reclassified to conform to current period
presentation. For more information on pay option loans, see
Consumer Portfolio Credit Risk Management – Purchased Credit-
impaired Residential Mortgage Loan Portfolio on page 82.
Table 26 Consumer Loans and Leases
December 31
Outstandings
Purchased Credit-impaired
Loan Portfolio
(Dollars in millions) 2013 2012 2013 2012
Residential mortgage (1) $ 248,066 $252,929 $18,672 $ 17,451
Home equity 93,672 108,140 6,593 8,667
U.S. credit card 92,338 94,835 n/a n/a
Non-U.S. credit card 11,541 11,697 n/a n/a
Direct/Indirect consumer (2) 82,192 83,205 n/a n/a
Other consumer (3) 1,977 1,628 n/a n/a
Consumer loans excluding loans accounted for under the fair value option 529,786 552,434 25,265 26,118
Loans accounted for under the fair value option (4) 2,164 1,005 n/a n/a
Total consumer loans and leases $ 531,950 $553,439 $25,265 $ 26,118
(1) Outstandings include pay option loans of $4.4 billion and $6.7 billion and non-U.S. residential mortgage loans of $0 and $93 million at December 31, 2013 and 2012. We no longer originate pay
option loans.
(2) Outstandings include dealer financial services loans of $38.5 billion and $35.9 billion, consumer lending loans of $2.7 billion and $4.7 billion, U.S. securities-based lending loans of $31.2 billion
and $28.3 billion, non-U.S. consumer loans of $4.7 billion and $8.3 billion, student loans of $4.1 billion and $4.8 billion and other consumer loans of $1.0 billion and $1.2 billion at December 31,
2013 and 2012.
(3) Outstandings include consumer finance loans of $1.2 billion and $1.4 billion, consumer leases of $606 million and $34 million, consumer overdrafts of $176 million and $177 million and other
non-U.S. consumer loans of $5 million and $5 million at December 31, 2013 and 2012.
(4) Consumer loans accounted for under the fair value option include residential mortgage loans of $2.0 billion and $1.0 billion and home equity loans of $147 million and $0 at December 31, 2013
and 2012. For more information on the fair value option, see Consumer Portfolio Credit Risk Management – Consumer Loans Accounted for Under the Fair Value Option on page 85 and Note 21 –
Fair Value Option to the Consolidated Financial Statements.
n/a = not applicable