Bank of America 2013 Annual Report Download - page 97
Download and view the complete annual report
Please find page 97 of the 2013 Bank of America annual report below. You can navigate through the pages in the report by either clicking on the pages listed below, or by using the keyword search tool below to find specific information within the annual report.-
 1
1 -
2
-
3
-
4
-
5
-
6
-
7
-
8
-
9
-
10
-
11
-
12
-
13
-
14
-
15
-
16
-
17
-
18
-
19
-
20
-
21
-
22
-
23
-
24
-
25
-
26
-
27
-
28
-
29
-
30
-
31
-
32
-
33
-
34
-
35
-
36
-
37
-
38
-
39
-
40
-
41
-
42
-
43
-
44
-
45
-
46
-
47
-
48
-
49
-
50
-
51
-
52
-
53
-
54
-
55
-
56
-
57
-
58
-
59
-
60
-
61
-
62
-
63
-
64
-
65
-
66
-
67
-
68
-
69
-
70
-
71
-
72
-
73
-
74
-
75
-
76
-
77
-
78
-
79
-
80
-
81
-
82
-
83
-
84
-
85
-
86
-
 87
87 -
 88
88 -
 89
89 -
 90
90 -
 91
91 -
 92
92 -
 93
93 -
 94
94 -
 95
95 -
 96
96 -
 97
97 -
 98
98 -
 99
99 -
 100
100 -
 101
101 -
 102
102 -
 103
103 -
 104
104 -
 105
105 -
 106
106 -
 107
107 -
108
-
109
-
110
-
111
-
112
-
113
-
114
-
115
-
116
-
117
-
118
-
119
-
120
-
121
-
122
-
123
-
124
-
125
-
126
-
127
-
128
-
129
-
130
-
131
-
132
-
133
-
134
-
135
-
136
-
137
-
138
-
139
-
140
-
141
-
142
-
143
-
144
-
145
-
146
-
147
-
148
-
149
-
150
-
151
-
152
-
153
-
154
-
155
-
156
-
157
-
158
-
159
-
160
-
161
-
162
-
163
-
164
-
165
-
166
-
167
-
168
-
169
-
170
-
171
-
172
-
173
-
174
-
175
-
176
-
177
-
178
-
179
-
180
-
181
-
182
-
183
-
184
-
185
-
186
-
187
-
188
-
189
-
190
-
191
-
192
-
193
-
194
-
195
-
196
-
197
-
198
-
199
-
200
-
201
-
202
-
203
-
204
-
205
-
206
-
207
-
208
-
209
-
210
-
211
-
212
-
213
-
214
-
215
-
216
-
217
-
218
-
219
-
220
-
221
-
222
-
223
-
224
-
225
-
226
-
227
-
228
-
229
-
230
-
231
-
232
-
233
-
234
-
235
-
236
-
237
-
238
-
239
-
240
-
241
-
242
-
243
-
244
-
245
-
246
-
247
-
248
-
249
-
250
-
251
-
252
-
253
-
254
-
255
-
256
-
257
-
258
-
259
-
260
-
261
-
262
-
263
-
264
-
265
-
266
-
267
-
268
-
269
-
270
-
271
-
272
-
273
-
274
-
275
-
276
-
277
-
278
-
279
-
280
-
281
-
282
-
283
-
284
 |
 |

Bank of America 2013 95
Monoline Exposure
Monoline exposure is reported in the insurance industry and
managed under insurance portfolio industry limits. We have
indirect exposure to monolines primarily in the form of guarantees
supporting our loans, investment portfolios, securitizations and
credit-enhanced securities as part of our public finance business,
and other selected products. Such indirect exposure exists when
we purchase credit protection from monolines to hedge all or a
portion of the credit risk on certain credit exposures including
loans and CDOs. We underwrite our public finance exposure by
evaluating the underlying securities.
We also have indirect exposure to monolines in the form of
guarantees supporting our mortgage and other loan sales. Indirect
exposure may exist when credit protection was purchased from
monolines to hedge all or a portion of the credit risk on certain
mortgage and other loan exposures. A loss may occur when we
are required to repurchase a loan due to a breach of the
representations and warranties, and the market value of the loan
has declined, or we are required to indemnify or provide recourse
for a guarantor’s loss. For more information regarding our exposure
to representations and warranties, see Off-Balance Sheet
Arrangements and Contractual Obligations – Representations and
Warranties on page 48 and Note 7 – Representations and
Warranties Obligations and Corporate Guarantees to the
Consolidated Financial Statements.
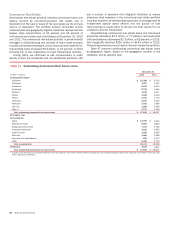
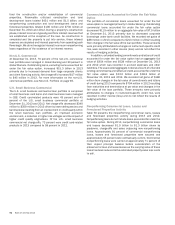
Table 53 presents the notional amount of our monoline
derivative credit exposure, mark-to-market adjustment and the
counterparty credit valuation adjustment. The notional amount of
monoline exposure decreased $2.9 billion in 2013 due to
terminations, paydowns and maturities of monoline contracts.
Table 53 Derivative Credit Exposures
December 31
(Dollars in millions) 2013 2012
Notional amount of monoline exposure $ 10,631 $ 13,547
Mark-to-market $97
$ 898
Counterparty credit valuation adjustment (15) (118)
Net mark-to-market $82
$ 780
2013 2012
Gains from credit valuation changes $73
$ 213
Risk Mitigation
We purchase credit protection to cover the funded portion as well
as the unfunded portion of certain credit exposures. To lower the
cost of obtaining our desired credit protection levels, we may add
credit exposure within an industry, borrower or counterparty group
by selling protection.
At December 31, 2013 and 2012, net notional credit default
protection purchased in our credit derivatives portfolio to hedge
our funded and unfunded exposures for which we elected the fair
value option, as well as certain other credit exposures, was $8.1
billion and $14.7 billion. The mark-to-market effects resulted in
net losses of $356 million in 2013 compared to $1.0 billion in
2012. The gains and losses on these instruments were offset by
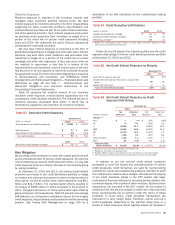
gains and losses on the exposures. Table 54 presents the average
VaR statistics at a 99 percent confidence interval for the hedged
credit exposure, the purchased credit protection and the remaining
position. See Trading Risk Management on page 105 for a
description of our VaR calculation for the market-based trading
portfolio.
Table 54 Credit Derivative VaR Statistics
(Dollars in millions) 2013 2012
Hedged credit exposure, average $44
$79
Purchased credit protection, average 19 52
Remaining, average (1) 28 24
(1) Reflects the diversification effect between net credit default protection hedging our credit
exposure and the related credit exposure.
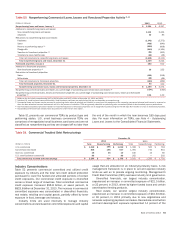
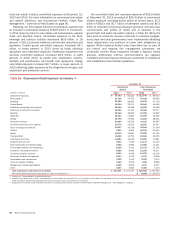
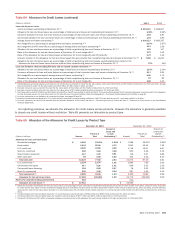
Tables 55 and 56 present the maturity profiles and the credit
exposure debt ratings of the net credit default protection portfolio
at December 31, 2013 and 2012.
Table 55 Net Credit Default Protection by Maturity
December 31
2013 2012
Less than or equal to one year 35% 21%
Greater than one year and less than or equal to five
years 63 75
Greater than five years 24
Total net credit default protection 100% 100%
Table 56 Net Credit Default Protection by Credit
Exposure Debt Rating
December 31
2013 2012
(Dollars in millions)
Net
Notional (1)
Percent of
Total
Net
Notional (1)
Percent of
Tota l
Ratings (2, 3)
AAA $— —%
$ (120) 0.8%
AA (7) 0.1 (474) 3.2
A(2,560) 31.7 (5,861) 40.0
BBB (3,880) 48.0 (6,067) 41.4
BB (1,137) 14.1 (1,101) 7.5
B(452) 5.6 (937) 6.4
CCC and below (115) 1.4 (247) 1.7
NR (4) 66 (0.9) 150 (1.0)
Total net credit
default protection $ (8,085) 100.0% $ (14,657) 100.0%
(1) Represents net credit default protection (purchased) sold.
(2) Ratings are refreshed on a quarterly basis.
(3) Ratings of BBB- or higher are considered to meet the definition of investment grade.
(4) NR is comprised of index positions held and any names that have not been rated.
In addition to our net notional credit default protection
purchased to cover the funded and unfunded portion of certain
credit exposures, credit derivatives are used for market-making
activities for clients and establishing positions intended to profit
from directional or relative value changes. We execute the majority
of our credit derivative trades in the OTC market with large,
multinational financial institutions, including broker/dealers and,
to a lesser degree, with a variety of other investors. Because these
transactions are executed in the OTC market, we are subject to
settlement risk. We are also subject to credit risk in the event that
these counterparties fail to perform under the terms of these
contracts. In most cases, credit derivative transactions are
executed on a daily margin basis. Therefore, events such as a
credit downgrade, depending on the ultimate rating level, or a
breach of credit covenants would typically require an increase in