Bank of America 2013 Annual Report Download - page 216
Download and view the complete annual report
Please find page 216 of the 2013 Bank of America annual report below. You can navigate through the pages in the report by either clicking on the pages listed below, or by using the keyword search tool below to find specific information within the annual report.-
 1
1 -
2
-
3
-
4
-
5
-
6
-
7
-
8
-
9
-
10
-
11
-
12
-
13
-
14
-
15
-
16
-
17
-
18
-
19
-
20
-
21
-
22
-
23
-
24
-
25
-
26
-
27
-
28
-
29
-
30
-
31
-
32
-
33
-
34
-
35
-
36
-
37
-
38
-
39
-
40
-
41
-
42
-
43
-
44
-
45
-
46
-
47
-
48
-
49
-
50
-
51
-
52
-
53
-
54
-
55
-
56
-
57
-
58
-
59
-
60
-
61
-
62
-
63
-
64
-
65
-
66
-
67
-
68
-
69
-
70
-
71
-
72
-
73
-
74
-
75
-
76
-
77
-
78
-
79
-
80
-
81
-
82
-
83
-
84
-
85
-
86
-
87
-
88
-
89
-
90
-
91
-
92
-
93
-
94
-
95
-
96
-
97
-
98
-
99
-
100
-
101
-
102
-
103
-
104
-
105
-
106
-
107
-
108
-
109
-
110
-
111
-
112
-
113
-
114
-
115
-
116
-
117
-
118
-
119
-
120
-
121
-
122
-
123
-
124
-
125
-
126
-
127
-
128
-
129
-
130
-
131
-
132
-
133
-
134
-
135
-
136
-
137
-
138
-
139
-
140
-
141
-
142
-
143
-
144
-
145
-
146
-
147
-
148
-
149
-
150
-
151
-
152
-
153
-
154
-
155
-
156
-
157
-
158
-
159
-
160
-
161
-
162
-
163
-
164
-
165
-
166
-
167
-
168
-
169
-
170
-
171
-
172
-
173
-
174
-
175
-
176
-
177
-
178
-
179
-
180
-
181
-
182
-
183
-
184
-
185
-
186
-
187
-
188
-
189
-
190
-
191
-
192
-
193
-
194
-
195
-
196
-
197
-
198
-
199
-
200
-
201
-
202
-
203
-
204
-
205
-
 206
206 -
 207
207 -
 208
208 -
 209
209 -
 210
210 -
 211
211 -
 212
212 -
 213
213 -
 214
214 -
 215
215 -
 216
216 -
 217
217 -
 218
218 -
 219
219 -
 220
220 -
 221
221 -
 222
222 -
 223
223 -
 224
224 -
 225
225 -
 226
226 -
227
-
228
-
229
-
230
-
231
-
232
-
233
-
234
-
235
-
236
-
237
-
238
-
239
-
240
-
241
-
242
-
243
-
244
-
245
-
246
-
247
-
248
-
249
-
250
-
251
-
252
-
253
-
254
-
255
-
256
-
257
-
258
-
259
-
260
-
261
-
262
-
263
-
264
-
265
-
266
-
267
-
268
-
269
-
270
-
271
-
272
-
273
-
274
-
275
-
276
-
277
-
278
-
279
-
280
-
281
-
282
-
283
-
284
 |
 |

214 Bank of America 2013
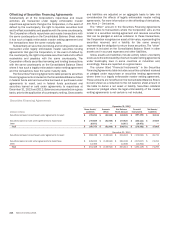
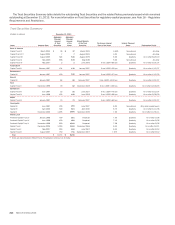
Offsetting of Securities Financing Agreements
Substantially all of the Corporation’s repurchase and resale
activities are transacted under legally enforceable master
repurchase agreements that give the Corporation, in the event of
default by the counterparty, the right to liquidate securities held
and to offset receivables and payables with the same counterparty.
The Corporation offsets repurchase and resale transactions with
the same counterparty on the Consolidated Balance Sheet where
it has such a legally enforceable master netting agreement and
the transactions have the same maturity date.
Substantially all securities borrowing and lending activities are
transacted under legally enforceable master securities lending
agreements that give the Corporation, in the event of default by
the counterparty, the right to liquidate securities held and to offset
receivables and payables with the same counterparty. The
Corporation offsets securities borrowing and lending transactions
with the same counterparty on the Consolidated Balance Sheet
where it has such a legally enforceable master netting agreement
and the transactions have the same maturity date.
The Securities Financing Agreements table presents securities
financing agreements included on the Consolidated Balance Sheet
in federal funds sold and securities borrowed or purchased under
agreements to resell, and in federal funds purchased and
securities loaned or sold under agreements to repurchase at
December 31, 2013 and 2012. Balances are presented on a gross
basis, prior to the application of counterparty netting. Gross assets
and liabilities are adjusted on an aggregate basis to take into
consideration the effects of legally enforceable master netting
agreements. For more information on the offsetting of derivatives,
see Note 2 – Derivatives.
The “Other” amount in the Securities Financing Agreements
table relates to transactions where the Corporation acts as the
lender in a securities lending agreement and receives securities
that can be pledged or sold as collateral. In these transactions,
the Corporation recognizes an asset at fair value, representing the
securities received, and a liability for the same amount,
representing the obligation to return those securities. The “other”
amount is included on the Consolidated Balance Sheet in other
assets and in accrued expenses and other liabilities.
Gross assets and liabilities include activity where uncertainty
exists as to the enforceability of certain master netting agreements
under bankruptcy laws in some countries or industries and,
accordingly, these are reported on a gross basis.
The column titled “Financial Instruments” in the Securities
Financing Agreements table includes securities collateral received
or pledged under repurchase or securities lending agreements
where there is a legally enforceable master netting agreement.
These amounts are not offset on the Consolidated Balance Sheet,
but are shown as a reduction to the net balance sheet amount in
the table to derive a net asset or liability. Securities collateral
received or pledged where the legal enforceability of the master
netting agreements is not certain is not included.
Securities Financing Agreements
December 31, 2013
(Dollars in millions)
Gross Assets/
Liabilities
Amounts
Offset
Net Balance
Sheet Amount
Financial
Instruments
Net Assets/
Liabilities
Securities borrowed or purchased under agreements to resell $ 272,296 $ (81,968) $ 190,328 $ (157,132) $ 33,196
Securities loaned or sold under agreements to repurchase $ 279,888 $ (81,968) $ 197,920 $ (160,111) $ 37,809
Other 10,871 — 10,871 (10,871) —
Total $ 290,759 $ (81,968) $ 208,791 $ (170,982) $ 37,809
December 31, 2012
Securities borrowed or purchased under agreements to resell $ 366,238 $ (146,914) $ 219,324 $ (173,593) $ 45,731
Securities loaned or sold under agreements to repurchase $ 439,022 $ (146,914) $ 292,108 $ (217,817) $ 74,291
Other 12,306 — 12,306 (12,302) 4
Total $ 451,328 $ (146,914) $ 304,414 $ (230,119) $ 74,295