Bank of America 2013 Annual Report Download - page 190
Download and view the complete annual report
Please find page 190 of the 2013 Bank of America annual report below. You can navigate through the pages in the report by either clicking on the pages listed below, or by using the keyword search tool below to find specific information within the annual report.-
 1
1 -
2
-
3
-
4
-
5
-
6
-
7
-
8
-
9
-
10
-
11
-
12
-
13
-
14
-
15
-
16
-
17
-
18
-
19
-
20
-
21
-
22
-
23
-
24
-
25
-
26
-
27
-
28
-
29
-
30
-
31
-
32
-
33
-
34
-
35
-
36
-
37
-
38
-
39
-
40
-
41
-
42
-
43
-
44
-
45
-
46
-
47
-
48
-
49
-
50
-
51
-
52
-
53
-
54
-
55
-
56
-
57
-
58
-
59
-
60
-
61
-
62
-
63
-
64
-
65
-
66
-
67
-
68
-
69
-
70
-
71
-
72
-
73
-
74
-
75
-
76
-
77
-
78
-
79
-
80
-
81
-
82
-
83
-
84
-
85
-
86
-
87
-
88
-
89
-
90
-
91
-
92
-
93
-
94
-
95
-
96
-
97
-
98
-
99
-
100
-
101
-
102
-
103
-
104
-
105
-
106
-
107
-
108
-
109
-
110
-
111
-
112
-
113
-
114
-
115
-
116
-
117
-
118
-
119
-
120
-
121
-
122
-
123
-
124
-
125
-
126
-
127
-
128
-
129
-
130
-
131
-
132
-
133
-
134
-
135
-
136
-
137
-
138
-
139
-
140
-
141
-
142
-
143
-
144
-
145
-
146
-
147
-
148
-
149
-
150
-
151
-
152
-
153
-
154
-
155
-
156
-
157
-
158
-
159
-
160
-
161
-
162
-
163
-
164
-
165
-
166
-
167
-
168
-
169
-
170
-
171
-
172
-
173
-
174
-
175
-
176
-
177
-
178
-
179
-
 180
180 -
 181
181 -
 182
182 -
 183
183 -
 184
184 -
 185
185 -
 186
186 -
 187
187 -
 188
188 -
 189
189 -
 190
190 -
 191
191 -
 192
192 -
 193
193 -
 194
194 -
 195
195 -
 196
196 -
 197
197 -
 198
198 -
 199
199 -
 200
200 -
201
-
202
-
203
-
204
-
205
-
206
-
207
-
208
-
209
-
210
-
211
-
212
-
213
-
214
-
215
-
216
-
217
-
218
-
219
-
220
-
221
-
222
-
223
-
224
-
225
-
226
-
227
-
228
-
229
-
230
-
231
-
232
-
233
-
234
-
235
-
236
-
237
-
238
-
239
-
240
-
241
-
242
-
243
-
244
-
245
-
246
-
247
-
248
-
249
-
250
-
251
-
252
-
253
-
254
-
255
-
256
-
257
-
258
-
259
-
260
-
261
-
262
-
263
-
264
-
265
-
266
-
267
-
268
-
269
-
270
-
271
-
272
-
273
-
274
-
275
-
276
-
277
-
278
-
279
-
280
-
281
-
282
-
283
-
284
 |
 |

188 Bank of America 2013
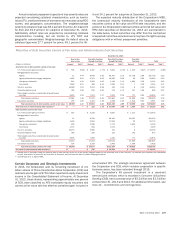
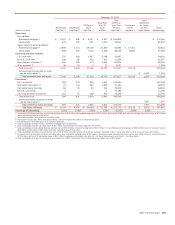
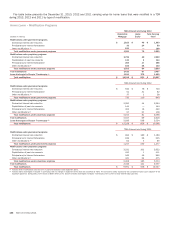
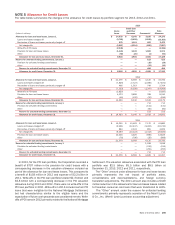
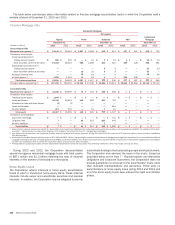
The table below presents the December 31, 2013, 2012 and 2011 carrying value for home loans that were modified in a TDR
during 2013, 2012 and 2011 by type of modification.
Home Loans – Modification Programs
TDRs Entered into During 2013
(Dollars in millions)
Residential
Mortgage
Home
Equity
Total Carrying
Value
Modifications under government programs
Contractual interest rate reduction $ 1,815 $ 48 $ 1,863
Principal and/or interest forbearance 35 24 59
Other modifications (1) 100 — 100
Total modifications under government programs 1,950 72 2,022
Modifications under proprietary programs
Contractual interest rate reduction 2,799 40 2,839
Capitalization of past due amounts 132 2 134
Principal and/or interest forbearance 469 17 486
Other modifications (1) 105 25 130
Total modifications under proprietary programs 3,505 84 3,589
Trial modifications 3,410 87 3,497
Loans discharged in Chapter 7 bankruptcy (2) 1,151 278 1,429
Total modifications $ 10,016 $ 521 $ 10,537
TDRs Entered into During 2012
Modifications under government programs
Contractual interest rate reduction $ 642 $ 78 $ 720
Principal and/or interest forbearance 51 31 82
Other modifications (1) 37 1 38
Total modifications under government programs 730 110 840
Modifications under proprietary programs
Contractual interest rate reduction 3,350 44 3,394
Capitalization of past due amounts 144 — 144
Principal and/or interest forbearance 424 16 440
Other modifications (1) 97 21 118
Total modifications under proprietary programs 4,015 81 4,096
Trial modifications 4,547 69 4,616
Loans discharged in Chapter 7 bankruptcy (2) 2,936 598 3,534
Total modifications $ 12,228 $ 858 $ 13,086
TDRs Entered into During 2011
Modifications under government programs
Contractual interest rate reduction $ 994 $ 189 $ 1,183
Principal and/or interest forbearance 189 36 225
Other modifications (1) 64 5 69
Total modifications under government programs 1,247 230 1,477
Modifications under proprietary programs
Contractual interest rate reduction 3,531 101 3,632
Capitalization of past due amounts 410 1 411
Principal and/or interest forbearance 946 49 995
Other modifications (1) 441 34 475
Total modifications under proprietary programs 5,328 185 5,513
Trial modifications 3,416 141 3,557
Total modifications $ 9,991 $ 556 $ 10,547
(1) Includes other modifications such as term or payment extensions and repayment plans.
(2) Includes loans discharged in Chapter 7 bankruptcy with no change in repayment terms that are classified as TDRs. The amount for 2012 represents the cumulative impact upon adoption of the
regulatory guidance. During 2013, home loans of $587 million, or 41 percent of loans discharged in Chapter 7 bankruptcy were current or less than 60 days past due.