Bank of America 2013 Annual Report Download - page 196
Download and view the complete annual report
Please find page 196 of the 2013 Bank of America annual report below. You can navigate through the pages in the report by either clicking on the pages listed below, or by using the keyword search tool below to find specific information within the annual report.-
 1
1 -
2
-
3
-
4
-
5
-
6
-
7
-
8
-
9
-
10
-
11
-
12
-
13
-
14
-
15
-
16
-
17
-
18
-
19
-
20
-
21
-
22
-
23
-
24
-
25
-
26
-
27
-
28
-
29
-
30
-
31
-
32
-
33
-
34
-
35
-
36
-
37
-
38
-
39
-
40
-
41
-
42
-
43
-
44
-
45
-
46
-
47
-
48
-
49
-
50
-
51
-
52
-
53
-
54
-
55
-
56
-
57
-
58
-
59
-
60
-
61
-
62
-
63
-
64
-
65
-
66
-
67
-
68
-
69
-
70
-
71
-
72
-
73
-
74
-
75
-
76
-
77
-
78
-
79
-
80
-
81
-
82
-
83
-
84
-
85
-
86
-
87
-
88
-
89
-
90
-
91
-
92
-
93
-
94
-
95
-
96
-
97
-
98
-
99
-
100
-
101
-
102
-
103
-
104
-
105
-
106
-
107
-
108
-
109
-
110
-
111
-
112
-
113
-
114
-
115
-
116
-
117
-
118
-
119
-
120
-
121
-
122
-
123
-
124
-
125
-
126
-
127
-
128
-
129
-
130
-
131
-
132
-
133
-
134
-
135
-
136
-
137
-
138
-
139
-
140
-
141
-
142
-
143
-
144
-
145
-
146
-
147
-
148
-
149
-
150
-
151
-
152
-
153
-
154
-
155
-
156
-
157
-
158
-
159
-
160
-
161
-
162
-
163
-
164
-
165
-
166
-
167
-
168
-
169
-
170
-
171
-
172
-
173
-
174
-
175
-
176
-
177
-
178
-
179
-
180
-
181
-
182
-
183
-
184
-
185
-
 186
186 -
 187
187 -
 188
188 -
 189
189 -
 190
190 -
 191
191 -
 192
192 -
 193
193 -
 194
194 -
 195
195 -
 196
196 -
 197
197 -
 198
198 -
 199
199 -
 200
200 -
 201
201 -
 202
202 -
 203
203 -
 204
204 -
 205
205 -
 206
206 -
207
-
208
-
209
-
210
-
211
-
212
-
213
-
214
-
215
-
216
-
217
-
218
-
219
-
220
-
221
-
222
-
223
-
224
-
225
-
226
-
227
-
228
-
229
-
230
-
231
-
232
-
233
-
234
-
235
-
236
-
237
-
238
-
239
-
240
-
241
-
242
-
243
-
244
-
245
-
246
-
247
-
248
-
249
-
250
-
251
-
252
-
253
-
254
-
255
-
256
-
257
-
258
-
259
-
260
-
261
-
262
-
263
-
264
-
265
-
266
-
267
-
268
-
269
-
270
-
271
-
272
-
273
-
274
-
275
-
276
-
277
-
278
-
279
-
280
-
281
-
282
-
283
-
284
 |
 |

194 Bank of America 2013
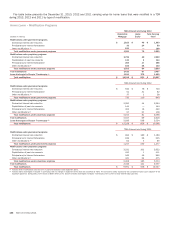
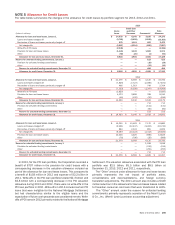
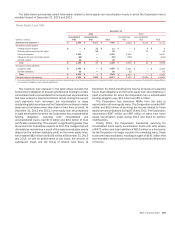
The table below presents the December 31, 2013, 2012 and
2011 unpaid principal balance and carrying value of commercial
loans that were modified as TDRs during 2013, 2012 and 2011,
and net charge-offs that were recorded during the period in which
the modification occurred. The table below includes loans that
were initially classified as TDRs during the period and, beginning
in the first quarter of 2013, also loans that had previously been
classified as TDRs and were modified again during the period.
Commercial – TDRs Entered into During 2013, 2012 and
2011
December 31, 2013 2013
(Dollars in millions)
Unpaid
Principal
Balance
Carrying
Value
Net
Charge-offs
U.S. commercial $ 926 $ 910 $ 33
Commercial real estate 483 425 3
Non-U.S. commercial 61 44 7
U.S. small business commercial (1) 891
Total $ 1,478 $ 1,388 $ 44
December 31, 2012 2012
U.S. commercial $ 590 $ 558 $ 34
Commercial real estate 793 721 20
Non-U.S. commercial 90 89 1
U.S. small business commercial (1) 22 22 5
Total $ 1,495 $ 1,390 $ 60
December 31, 2011 2011
U.S. commercial $ 1,381 $ 1,211 $ 74
Commercial real estate 1,604 1,333 152
Non-U.S. commercial 44 44 —
U.S. small business commercial (1) 58 59 10
Total $ 3,087 $ 2,647 $ 236
(1) U.S. small business commercial TDRs are comprised of renegotiated small business card loans.
A commercial TDR is generally deemed to be in payment default
when the loan is 90 days or more past due, including delinquencies
that were not resolved as part of the modification. U.S. small
business commercial TDRs are deemed to be in payment default
during the quarter in which a borrower misses the second of two
consecutive payments. Payment defaults are one of the factors
considered when projecting future cash flows, along with
observable market prices or fair value of collateral when measuring
the allowance for loan losses. TDRs that were in payment default
had a carrying value of $55 million, $130 million and $164 million
for U.S. commercial, $128 million, $455 million and $446 million
for commercial real estate, and $0, $18 million and $68 million
for U.S. small business commercial at December 31, 2013, 2012
and 2011, respectively.
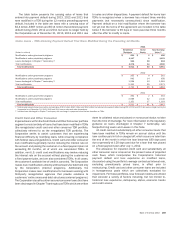
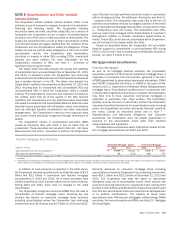
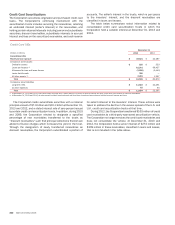
Purchased Credit-impaired Loans
PCI loans are acquired loans with evidence of credit quality
deterioration since origination for which it is probable at purchase
date that the Corporation will be unable to collect all contractually
required payments. The following table provides details on PCI
loans acquired in connection with the January 6, 2013 settlement
with FNMA (the FNMA Settlement).
Purchased Loans at Acquisition Date
(Dollars in millions)
Contractually required payments including interest $ 8,274
Less: Nonaccretable difference 2,159
Cash flows expected to be collected (1) 6,115
Less: Accretable yield 1,125
Fair value of loans acquired $ 4,990
(1) Represents undiscounted expected principal and interest cash flows at acquisition.
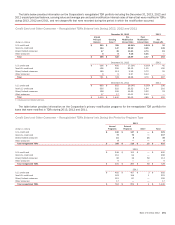
The table below shows activity for the accretable yield on PCI
loans, which includes the Countrywide Financial Corporation
(Countrywide) portfolio and loans repurchased in connection with
the FNMA Settlement. For more information on the FNMA
Settlement, see Note 7 – Representations and Warranties
Obligations and Corporate Guarantees. The amount of accretable
yield is affected by changes in credit outlooks, including metrics
such as default rates and loss severities, prepayments speeds,
which can change the amount and period of time over which
interest payments are expected to be received, and the interest
rates on variable rate loans. The reclassifications from
nonaccretable difference during 2013 were due to increases in
expected cash flows driven by improved home prices and lower
expected defaults, along with a decrease in forecasted prepayment
speeds as a result of rising interest rates. Changes in the
prepayment assumption affect the expected remaining life of the
portfolio which results in a change to the amount of future interest
cash flows.
Rollforward of Accretable Yield
(Dollars in millions)
Accretable yield, January 1, 2012 $ 4,990
Accretion (1,034)
Disposals/transfers (109)
Reclassifications from nonaccretable difference 797
Accretable yield, December 31, 2012 4,644
Accretion (1,194)
Loans purchased 1,125
Disposals/transfers (361)
Reclassifications from nonaccretable difference 2,480
Accretable yield, December 31, 2013 $ 6,694
For more information on PCI loans, see Note 1 – Summary of
Significant Accounting Principles, and for the carrying value and
valuation allowance for PCI loans, see Note 5 – Allowance for Credit
Losses.
Loans Held-for-sale
The Corporation had LHFS of $11.4 billion and $19.4 billion at
December 31, 2013 and 2012. Proceeds, including cash and
securities, from sales, securitizations and paydowns of LHFS were
$81.0 billion, $58.0 billion and $142.4 billion for 2013, 2012 and
2011, respectively. Amounts used for originations and purchases
of LHFS were $65.7 billion, $59.5 billion and $118.2 billion for
2013, 2012 and 2011, respectively.