Bank of America 2013 Annual Report Download - page 91
Download and view the complete annual report
Please find page 91 of the 2013 Bank of America annual report below. You can navigate through the pages in the report by either clicking on the pages listed below, or by using the keyword search tool below to find specific information within the annual report.-
 1
1 -
2
-
3
-
4
-
5
-
6
-
7
-
8
-
9
-
10
-
11
-
12
-
13
-
14
-
15
-
16
-
17
-
18
-
19
-
20
-
21
-
22
-
23
-
24
-
25
-
26
-
27
-
28
-
29
-
30
-
31
-
32
-
33
-
34
-
35
-
36
-
37
-
38
-
39
-
40
-
41
-
42
-
43
-
44
-
45
-
46
-
47
-
48
-
49
-
50
-
51
-
52
-
53
-
54
-
55
-
56
-
57
-
58
-
59
-
60
-
61
-
62
-
63
-
64
-
65
-
66
-
67
-
68
-
69
-
70
-
71
-
72
-
73
-
74
-
75
-
76
-
77
-
78
-
79
-
80
-
 81
81 -
 82
82 -
 83
83 -
 84
84 -
 85
85 -
 86
86 -
 87
87 -
 88
88 -
 89
89 -
 90
90 -
 91
91 -
 92
92 -
 93
93 -
 94
94 -
 95
95 -
 96
96 -
 97
97 -
 98
98 -
 99
99 -
 100
100 -
 101
101 -
102
-
103
-
104
-
105
-
106
-
107
-
108
-
109
-
110
-
111
-
112
-
113
-
114
-
115
-
116
-
117
-
118
-
119
-
120
-
121
-
122
-
123
-
124
-
125
-
126
-
127
-
128
-
129
-
130
-
131
-
132
-
133
-
134
-
135
-
136
-
137
-
138
-
139
-
140
-
141
-
142
-
143
-
144
-
145
-
146
-
147
-
148
-
149
-
150
-
151
-
152
-
153
-
154
-
155
-
156
-
157
-
158
-
159
-
160
-
161
-
162
-
163
-
164
-
165
-
166
-
167
-
168
-
169
-
170
-
171
-
172
-
173
-
174
-
175
-
176
-
177
-
178
-
179
-
180
-
181
-
182
-
183
-
184
-
185
-
186
-
187
-
188
-
189
-
190
-
191
-
192
-
193
-
194
-
195
-
196
-
197
-
198
-
199
-
200
-
201
-
202
-
203
-
204
-
205
-
206
-
207
-
208
-
209
-
210
-
211
-
212
-
213
-
214
-
215
-
216
-
217
-
218
-
219
-
220
-
221
-
222
-
223
-
224
-
225
-
226
-
227
-
228
-
229
-
230
-
231
-
232
-
233
-
234
-
235
-
236
-
237
-
238
-
239
-
240
-
241
-
242
-
243
-
244
-
245
-
246
-
247
-
248
-
249
-
250
-
251
-
252
-
253
-
254
-
255
-
256
-
257
-
258
-
259
-
260
-
261
-
262
-
263
-
264
-
265
-
266
-
267
-
268
-
269
-
270
-
271
-
272
-
273
-
274
-
275
-
276
-
277
-
278
-
279
-
280
-
281
-
282
-
283
-
284
 |
 |

Bank of America 2013 89
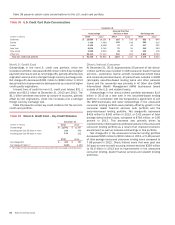
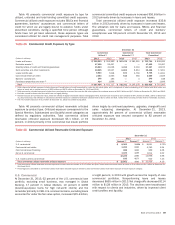
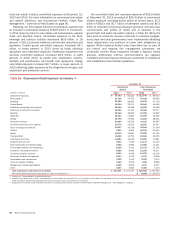
Table 45 presents commercial credit exposure by type for
utilized, unfunded and total binding committed credit exposure.
Commercial utilized credit exposure includes SBLCs and financial
guarantees, bankers’ acceptances and commercial letters of
credit for which we are legally bound to advance funds under
prescribed conditions, during a specified time period. Although
funds have not yet been advanced, these exposure types are
considered utilized for credit risk management purposes. Total
commercial committed credit exposure increased $56.8 billion in
2013 primarily driven by increases in loans and leases.
Total commercial utilized credit exposure increased $35.8
billion in 2013 primarily driven by increases in loans and leases.
The utilization rate for loans and leases, SBLCs and financial
guarantees, commercial letters of credit and bankers’
acceptances was 58 percent at both December 31, 2013 and
2012.
Table 45 Commercial Credit Exposure by Type
December 31
Commercial
Utilized (1)
Commercial
Unfunded (2, 3)
Total Commercial
Committed
(Dollars in millions) 2013 2012 2013 2012 2013 2012
Loans and leases $ 396,283 $354,380 $ 307,478 $281,915 $ 703,761 $ 636,295
Derivative assets (4) 47,495 53,497 ——47,495 53,497
Standby letters of credit and financial guarantees 35,893 41,036 1,334 2,119 37,227 43,155
Debt securities and other investments 18,505 10,937 6,903 6,914 25,408 17,851
Loans held-for-sale 6,604 7,928 101 3,763 6,705 11,691
Commercial letters of credit 2,054 2,065 515 564 2,569 2,629
Bankers’ acceptances 246 185 —3246 188
Foreclosed properties and other (5) 414 1,699 ——414 1,699
Total $ 507,494 $471,727 $ 316,331 $295,278 $ 823,825 $ 767,005
(1) Total commercial utilized exposure includes loans and issued letters of credit accounted for under the fair value option and is comprised of loans outstanding of $7.9 billion and $8.0 billion and
letters of credit with a notional amount of $503 million and $672 million at December 31, 2013 and 2012.
(2) Total commercial unfunded exposure includes loan commitments accounted for under the fair value option with a notional amount of $12.5 billion and $17.6 billion at December 31, 2013 and 2012.
(3) Excludes unused business card lines which are not legally binding.
(4) Derivative assets are carried at fair value, reflect the effects of legally enforceable master netting agreements and have been reduced by cash collateral of $47.3 billion and $58.1 billion at December
31, 2013 and 2012. Not reflected in utilized and committed exposure is additional derivative collateral held of $17.1 billion and $18.7 billion which consists primarily of other marketable securities.
(5) The net monoline exposure of $1.3 billion at December 31, 2012 was settled during 2013.
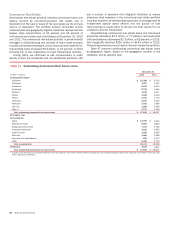
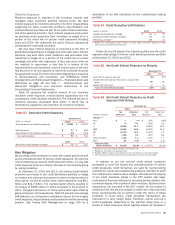
Table 46 presents commercial utilized reservable criticized
exposure by product type. Criticized exposure corresponds to the
Special Mention, Substandard and Doubtful asset categories as
defined by regulatory authorities. Total commercial utilized
reservable criticized exposure decreased $3.1 billion, or 19
percent, in 2013 primarily in the commercial real estate portfolio
driven largely by continued paydowns, upgrades, charge-offs and
sales outpacing downgrades. At December 31, 2013,
approximately 84 percent of commercial utilized reservable
criticized exposure was secured compared to 82 percent at
December 31, 2012.
Table 46 Commercial Utilized Reservable Criticized Exposure
December 31
2013 2012
(Dollars in millions) Amount (1) Percent (2) Amount (1) Percent (2)
U.S. commercial $ 8,362 3.45%$ 8,631 3.72%
Commercial real estate 1,452 2.92 3,782 9.24
Commercial lease financing 988 3.92 969 4.06
Non-U.S. commercial 1,424 1.49 1,614 2.02
12,226 2.96 14,996 3.98
U.S. small business commercial 635 4.77 940 7.45
Total commercial utilized reservable criticized exposure $ 12,861 3.02 $ 15,936 4.10
(1) Total commercial utilized reservable criticized exposure includes loans and leases of $11.5 billion and $14.6 billion and commercial letters of credit of $1.4 billion and $1.3 billion at December 31,
2013 and 2012.
(2) Percentages are calculated as commercial utilized reservable criticized exposure divided by total commercial utilized reservable exposure for each exposure category.
U.S. Commercial
At December 31, 2013, 62 percent of the U.S. commercial loan
portfolio, excluding small business, was managed in Global
Banking, 17 percent in Global Markets, 10 percent in GWIM
(business-purpose loans for high net-worth clients) and the
remainder primarily in CBB. U.S. commercial loans, excluding loans
accounted for under the fair value option, increased $15.4 billion,
or eight percent, in 2013 with growth across the majority of core
commercial portfolios. Nonperforming loans and leases
decreased $665 million in 2013. Net charge-offs decreased $114
million to $128 million in 2013. The declines were broad-based
with respect to clients and industries, driven by improved client
credit profiles and liquidity.