Bank of America 2013 Annual Report Download - page 193
Download and view the complete annual report
Please find page 193 of the 2013 Bank of America annual report below. You can navigate through the pages in the report by either clicking on the pages listed below, or by using the keyword search tool below to find specific information within the annual report.-
 1
1 -
2
-
3
-
4
-
5
-
6
-
7
-
8
-
9
-
10
-
11
-
12
-
13
-
14
-
15
-
16
-
17
-
18
-
19
-
20
-
21
-
22
-
23
-
24
-
25
-
26
-
27
-
28
-
29
-
30
-
31
-
32
-
33
-
34
-
35
-
36
-
37
-
38
-
39
-
40
-
41
-
42
-
43
-
44
-
45
-
46
-
47
-
48
-
49
-
50
-
51
-
52
-
53
-
54
-
55
-
56
-
57
-
58
-
59
-
60
-
61
-
62
-
63
-
64
-
65
-
66
-
67
-
68
-
69
-
70
-
71
-
72
-
73
-
74
-
75
-
76
-
77
-
78
-
79
-
80
-
81
-
82
-
83
-
84
-
85
-
86
-
87
-
88
-
89
-
90
-
91
-
92
-
93
-
94
-
95
-
96
-
97
-
98
-
99
-
100
-
101
-
102
-
103
-
104
-
105
-
106
-
107
-
108
-
109
-
110
-
111
-
112
-
113
-
114
-
115
-
116
-
117
-
118
-
119
-
120
-
121
-
122
-
123
-
124
-
125
-
126
-
127
-
128
-
129
-
130
-
131
-
132
-
133
-
134
-
135
-
136
-
137
-
138
-
139
-
140
-
141
-
142
-
143
-
144
-
145
-
146
-
147
-
148
-
149
-
150
-
151
-
152
-
153
-
154
-
155
-
156
-
157
-
158
-
159
-
160
-
161
-
162
-
163
-
164
-
165
-
166
-
167
-
168
-
169
-
170
-
171
-
172
-
173
-
174
-
175
-
176
-
177
-
178
-
179
-
180
-
181
-
182
-
 183
183 -
 184
184 -
 185
185 -
 186
186 -
 187
187 -
 188
188 -
 189
189 -
 190
190 -
 191
191 -
 192
192 -
 193
193 -
 194
194 -
 195
195 -
 196
196 -
 197
197 -
 198
198 -
 199
199 -
 200
200 -
 201
201 -
 202
202 -
 203
203 -
204
-
205
-
206
-
207
-
208
-
209
-
210
-
211
-
212
-
213
-
214
-
215
-
216
-
217
-
218
-
219
-
220
-
221
-
222
-
223
-
224
-
225
-
226
-
227
-
228
-
229
-
230
-
231
-
232
-
233
-
234
-
235
-
236
-
237
-
238
-
239
-
240
-
241
-
242
-
243
-
244
-
245
-
246
-
247
-
248
-
249
-
250
-
251
-
252
-
253
-
254
-
255
-
256
-
257
-
258
-
259
-
260
-
261
-
262
-
263
-
264
-
265
-
266
-
267
-
268
-
269
-
270
-
271
-
272
-
273
-
274
-
275
-
276
-
277
-
278
-
279
-
280
-
281
-
282
-
283
-
284
 |
 |

Bank of America 2013 191
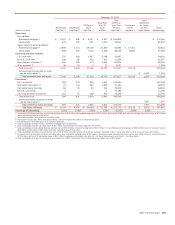
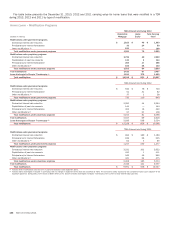
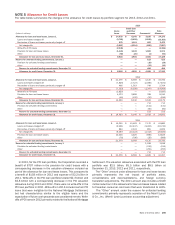
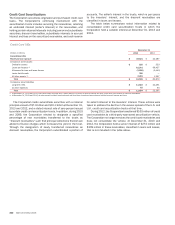
The table below provides information on the Corporation’s renegotiated TDR portfolio including the December 31, 2013, 2012 and
2011 unpaid principal balance, carrying value and average pre- and post-modification interest rates of loans that were modified in TDRs
during 2013, 2012 and 2011, and net charge-offs that were recorded during the period in which the modification occurred.
Credit Card and Other Consumer – Renegotiated TDRs Entered into During 2013, 2012 and 2011
December 31, 2013 2013
(Dollars in millions)
Unpaid
Principal
Balance
Carrying
Value (1)
Pre-
Modification
Interest Rate
Post-
Modification
Interest Rate
Net
Charge-offs
U.S. credit card $299 $329 16.84% 5.84%$ 30
Non-U.S. credit card 134 147 25.90 0.95 138
Direct/Indirect consumer 47 38 11.53 4.74 15
Other consumer 88
9.28 5.25 —
Total $488 $522 18.89 4.37 $ 183
December 31, 2012 2012
U.S. credit card $ 396 $ 400 17.59% 6.36% $ 45
Non-U.S. credit card 196 206 26.19 1.15 190
Direct/Indirect consumer 160 113 9.59 5.72 52
Other consumer 9 9 9.97 6.44 —
Total $ 761 $ 728 18.68 4.79 $ 287
December 31, 2011 2011
U.S. credit card $ 890 $ 902 19.04% 6.16% $ 106
Non-U.S. credit card 305 322 26.32 1.04 291
Direct/Indirect consumer 198 199 15.63 5.22 23
Other consumer 17 17 10.01 6.53 —
Total $ 1,410 $ 1,440 20.09 4.89 $ 420
(1) Includes accrued interest and fees.
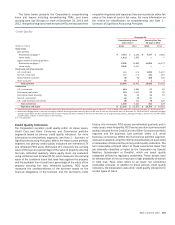
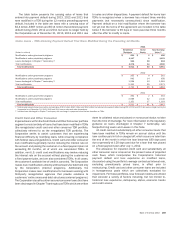
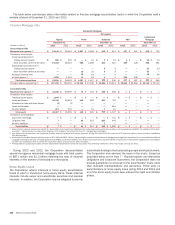
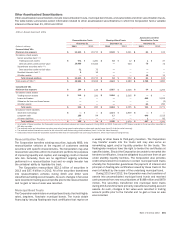
The table below provides information on the Corporation’s primary modification programs for the renegotiated TDR portfolio for
loans that were modified in TDRs during 2013, 2012 and 2011.
Credit Card and Other Consumer – Renegotiated TDRs Entered into During the Period by Program Type
2013
(Dollars in millions)
Internal
Programs
External
Programs Other Total
U.S. credit card $192 $137 $—$ 329
Non-U.S. credit card 73 74 —147
Direct/Indirect consumer 15 8 15 38
Other consumer 8——8
Total renegotiated TDRs $ 288 $219 $15 $ 522
2012
U.S. credit card $ 248 $ 152 $ — $ 400
Non-U.S. credit card 112 94 — 206
Direct/Indirect consumer 36 19 58 113
Other consumer 9—— 9
Total renegotiated TDRs $ 405 $ 265 $ 58 $ 728
2011
U.S. credit card $ 492 $ 407 $ 3 $ 902
Non-U.S. credit card 163 158 1 322
Direct/Indirect consumer 112 87 — 199
Other consumer 17 — — 17
Total renegotiated TDRs $ 784 $ 652 $ 4 $ 1,440