Bank of America 2013 Annual Report Download - page 143
Download and view the complete annual report
Please find page 143 of the 2013 Bank of America annual report below. You can navigate through the pages in the report by either clicking on the pages listed below, or by using the keyword search tool below to find specific information within the annual report.-
 1
1 -
2
-
3
-
4
-
5
-
6
-
7
-
8
-
9
-
10
-
11
-
12
-
13
-
14
-
15
-
16
-
17
-
18
-
19
-
20
-
21
-
22
-
23
-
24
-
25
-
26
-
27
-
28
-
29
-
30
-
31
-
32
-
33
-
34
-
35
-
36
-
37
-
38
-
39
-
40
-
41
-
42
-
43
-
44
-
45
-
46
-
47
-
48
-
49
-
50
-
51
-
52
-
53
-
54
-
55
-
56
-
57
-
58
-
59
-
60
-
61
-
62
-
63
-
64
-
65
-
66
-
67
-
68
-
69
-
70
-
71
-
72
-
73
-
74
-
75
-
76
-
77
-
78
-
79
-
80
-
81
-
82
-
83
-
84
-
85
-
86
-
87
-
88
-
89
-
90
-
91
-
92
-
93
-
94
-
95
-
96
-
97
-
98
-
99
-
100
-
101
-
102
-
103
-
104
-
105
-
106
-
107
-
108
-
109
-
110
-
111
-
112
-
113
-
114
-
115
-
116
-
117
-
118
-
119
-
120
-
121
-
122
-
123
-
124
-
125
-
126
-
127
-
128
-
129
-
130
-
131
-
132
-
 133
133 -
 134
134 -
 135
135 -
 136
136 -
 137
137 -
 138
138 -
 139
139 -
 140
140 -
 141
141 -
 142
142 -
 143
143 -
 144
144 -
 145
145 -
 146
146 -
 147
147 -
 148
148 -
 149
149 -
 150
150 -
 151
151 -
 152
152 -
 153
153 -
154
-
155
-
156
-
157
-
158
-
159
-
160
-
161
-
162
-
163
-
164
-
165
-
166
-
167
-
168
-
169
-
170
-
171
-
172
-
173
-
174
-
175
-
176
-
177
-
178
-
179
-
180
-
181
-
182
-
183
-
184
-
185
-
186
-
187
-
188
-
189
-
190
-
191
-
192
-
193
-
194
-
195
-
196
-
197
-
198
-
199
-
200
-
201
-
202
-
203
-
204
-
205
-
206
-
207
-
208
-
209
-
210
-
211
-
212
-
213
-
214
-
215
-
216
-
217
-
218
-
219
-
220
-
221
-
222
-
223
-
224
-
225
-
226
-
227
-
228
-
229
-
230
-
231
-
232
-
233
-
234
-
235
-
236
-
237
-
238
-
239
-
240
-
241
-
242
-
243
-
244
-
245
-
246
-
247
-
248
-
249
-
250
-
251
-
252
-
253
-
254
-
255
-
256
-
257
-
258
-
259
-
260
-
261
-
262
-
263
-
264
-
265
-
266
-
267
-
268
-
269
-
270
-
271
-
272
-
273
-
274
-
275
-
276
-
277
-
278
-
279
-
280
-
281
-
282
-
283
-
284
 |
 |

Bank of America 2013 141
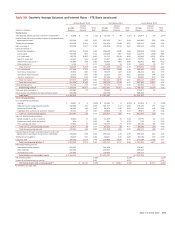
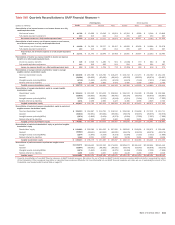
Table XVII Quarterly Reconciliations to GAAP Financial Measures (1)
2013 Quarters 2012 Quarters
(Dollars in millions) Fourth Third Second First Fourth Third Second First
Reconciliation of net interest income to net interest income on a fully
taxable-equivalent basis
Net interest income $ 10,786 $ 10,266 $ 10,549 $ 10,664 $ 10,324 $ 9,938 $ 9,548 $ 10,846
Fully taxable-equivalent adjustment 213 213 222 211 231 229 234 207
Net interest income on a fully taxable-equivalent basis $ 10,999 $ 10,479 $ 10,771 $ 10,875 $ 10,555 $ 10,167 $ 9,782 $ 11,053
Reconciliation of total revenue, net of interest expense to total revenue,
net of interest expense on a fully taxable-equivalent basis
Total revenue, net of interest expense $ 21,488 $ 21,530 $ 22,727 $ 23,197 $ 18,660 $ 20,428 $21,968 $22,278
Fully taxable-equivalent adjustment 213 213 222 211 231 229 234 207
Total revenue, net of interest expense on a fully taxable-equivalent
basis $ 21,701 $ 21,743 $ 22,949 $ 23,408 $ 18,891 $ 20,657 $22,202 $22,485
Reconciliation of income tax expense (benefit) to income tax expense
(benefit) on a fully taxable-equivalent basis
Income tax expense (benefit) $ 406 $ 2,348 $ 1,486 $ 501 $ (2,636) $ 770 $684 $66
Fully taxable-equivalent adjustment 213 213 222 211 231 229 234 207
Income tax expense (benefit) on a fully taxable-equivalent basis $ 619 $ 2,561 $ 1,708 $ 712 $ (2,405) $ 999 $918 $273
Reconciliation of average common shareholders’ equity to average
tangible common shareholders’ equity
Common shareholders’ equity $ 220,088 $ 216,766 $ 218,790 $ 218,225 $ 219,744 $ 217,273 $ 216,782 $ 214,150
Goodwill (69,864) (69,903) (69,930) (69,945) (69,976) (69,976) (69,976) (69,967)
Intangible assets (excluding MSRs) (5,725) (5,993) (6,270) (6,549) (6,874) (7,194) (7,533) (7,869)
Related deferred tax liabilities 2,231 2,296 2,360 2,425 2,490 2,556 2,626 2,700
Tangible common shareholders’ equity $ 146,730 $ 143,166 $ 144,950 $ 144,156 $ 145,384 $ 142,659 $ 141,899 $ 139,014
Reconciliation of average shareholders’ equity to average tangible
shareholders’ equity
Shareholders’ equity $ 233,415 $ 230,392 $ 235,063 $ 236,995 $ 238,512 $ 236,039 $ 235,558 $ 232,566
Goodwill (69,864) (69,903) (69,930) (69,945) (69,976) (69,976) (69,976) (69,967)
Intangible assets (excluding MSRs) (5,725) (5,993) (6,270) (6,549) (6,874) (7,194) (7,533) (7,869)
Related deferred tax liabilities 2,231 2,296 2,360 2,425 2,490 2,556 2,626 2,700
Tangible shareholders’ equity $ 160,057 $ 156,792 $ 161,223 $ 162,926 $ 164,152 $ 161,425 $ 160,675 $ 157,430
Reconciliation of period-end common shareholders’ equity to period-end
tangible common shareholders’ equity
Common shareholders’ equity $ 219,333 $ 218,967 $ 216,791 $ 218,513 $ 218,188 $ 219,838 $ 217,213 $ 213,711
Goodwill (69,844) (69,891) (69,930) (69,930) (69,976) (69,976) (69,976) (69,976)
Intangible assets (excluding MSRs) (5,574) (5,843) (6,104) (6,379) (6,684) (7,030) (7,335) (7,696)
Related deferred tax liabilities 2,166 2,231 2,297 2,363 2,428 2,494 2,559 2,628
Tangible common shareholders’ equity $ 146,081 $ 145,464 $ 143,054 $ 144,567 $ 143,956 $ 145,326 $ 142,461 $ 138,667
Reconciliation of period-end shareholders’ equity to period-end tangible
shareholders’ equity
Shareholders’ equity $ 232,685 $ 232,282 $ 231,032 $ 237,293 $ 236,956 $ 238,606 $ 235,975 $ 232,499
Goodwill (69,844) (69,891) (69,930) (69,930) (69,976) (69,976) (69,976) (69,976)
Intangible assets (excluding MSRs) (5,574) (5,843) (6,104) (6,379) (6,684) (7,030) (7,335) (7,696)
Related deferred tax liabilities 2,166 2,231 2,297 2,363 2,428 2,494 2,559 2,628
Tangible shareholders’ equity $ 159,433 $ 158,779 $ 157,295 $ 163,347 $ 162,724 $ 164,094 $ 161,223 $ 157,455
Reconciliation of period-end assets to period-end tangible assets
Assets $ 2,102,273 $2,126,653 $2,123,320 $2,174,819 $2,209,974 $2,166,162 $2,160,854 $2,181,449
Goodwill (69,844) (69,891) (69,930) (69,930) (69,976) (69,976) (69,976) (69,976)
Intangible assets (excluding MSRs) (5,574) (5,843) (6,104) (6,379) (6,684) (7,030) (7,335) (7,696)
Related deferred tax liabilities 2,166 2,231 2,297 2,363 2,428 2,494 2,559 2,628
Tangible assets $ 2,029,021 $2,053,150 $2,049,583 $2,100,873 $2,135,742 $2,091,650 $2,086,102 $2,106,405
(1) Presents reconciliations of non-GAAP financial measures to GAAP financial measures. We believe the use of these non-GAAP financial measures provides additional clarity in assessing the results
of the Corporation. Other companies may define or calculate these measures differently. For more information on non-GAAP financial measures and ratios we use in assessing the results of the
Corporation, see Supplemental Financial Data on page 29.