Bank of America 2013 Annual Report Download - page 31
Download and view the complete annual report
Please find page 31 of the 2013 Bank of America annual report below. You can navigate through the pages in the report by either clicking on the pages listed below, or by using the keyword search tool below to find specific information within the annual report.-
 1
1 -
2
-
3
-
4
-
5
-
6
-
7
-
8
-
9
-
10
-
11
-
12
-
13
-
14
-
15
-
16
-
17
-
18
-
19
-
20
-
 21
21 -
 22
22 -
 23
23 -
 24
24 -
 25
25 -
 26
26 -
 27
27 -
 28
28 -
 29
29 -
 30
30 -
 31
31 -
 32
32 -
 33
33 -
 34
34 -
 35
35 -
 36
36 -
 37
37 -
 38
38 -
 39
39 -
 40
40 -
 41
41 -
42
-
43
-
44
-
45
-
46
-
47
-
48
-
49
-
50
-
51
-
52
-
53
-
54
-
55
-
56
-
57
-
58
-
59
-
60
-
61
-
62
-
63
-
64
-
65
-
66
-
67
-
68
-
69
-
70
-
71
-
72
-
73
-
74
-
75
-
76
-
77
-
78
-
79
-
80
-
81
-
82
-
83
-
84
-
85
-
86
-
87
-
88
-
89
-
90
-
91
-
92
-
93
-
94
-
95
-
96
-
97
-
98
-
99
-
100
-
101
-
102
-
103
-
104
-
105
-
106
-
107
-
108
-
109
-
110
-
111
-
112
-
113
-
114
-
115
-
116
-
117
-
118
-
119
-
120
-
121
-
122
-
123
-
124
-
125
-
126
-
127
-
128
-
129
-
130
-
131
-
132
-
133
-
134
-
135
-
136
-
137
-
138
-
139
-
140
-
141
-
142
-
143
-
144
-
145
-
146
-
147
-
148
-
149
-
150
-
151
-
152
-
153
-
154
-
155
-
156
-
157
-
158
-
159
-
160
-
161
-
162
-
163
-
164
-
165
-
166
-
167
-
168
-
169
-
170
-
171
-
172
-
173
-
174
-
175
-
176
-
177
-
178
-
179
-
180
-
181
-
182
-
183
-
184
-
185
-
186
-
187
-
188
-
189
-
190
-
191
-
192
-
193
-
194
-
195
-
196
-
197
-
198
-
199
-
200
-
201
-
202
-
203
-
204
-
205
-
206
-
207
-
208
-
209
-
210
-
211
-
212
-
213
-
214
-
215
-
216
-
217
-
218
-
219
-
220
-
221
-
222
-
223
-
224
-
225
-
226
-
227
-
228
-
229
-
230
-
231
-
232
-
233
-
234
-
235
-
236
-
237
-
238
-
239
-
240
-
241
-
242
-
243
-
244
-
245
-
246
-
247
-
248
-
249
-
250
-
251
-
252
-
253
-
254
-
255
-
256
-
257
-
258
-
259
-
260
-
261
-
262
-
263
-
264
-
265
-
266
-
267
-
268
-
269
-
270
-
271
-
272
-
273
-
274
-
275
-
276
-
277
-
278
-
279
-
280
-
281
-
282
-
283
-
284
 |
 |

Bank of America 2013 29
Supplemental Financial Data
We view net interest income and related ratios and analyses on a
FTE basis, which when presented on a consolidated basis, are
non-GAAP financial measures. We believe managing the business
with net interest income on a FTE basis provides a more accurate
picture of the interest margin for comparative purposes. To derive
the FTE basis, net interest income is adjusted to reflect tax-exempt
income on an equivalent before-tax basis with a corresponding
increase in income tax expense. For purposes of this calculation,
we use the federal statutory tax rate of 35 percent. This measure
ensures comparability of net interest income arising from taxable
and tax-exempt sources.
Certain performance measures including the efficiency ratio
and net interest yield utilize net interest income (and thus total
revenue) on a FTE basis. The efficiency ratio measures the costs
expended to generate a dollar of revenue, and net interest yield
measures the bps we earn over the cost of funds.
We also evaluate our business based on certain ratios that
utilize tangible equity, a non-GAAP financial measure. Tangible
equity represents an adjusted shareholders’ equity or common
shareholders’ equity amount which has been reduced by goodwill
and intangible assets (excluding mortgage servicing rights
(MSRs)), net of related deferred tax liabilities. These measures
are used to evaluate our use of equity. In addition, profitability,
relationship and investment models all use return on average
tangible shareholders’ equity (ROTE) as key measures to support
our overall growth goals. These ratios are as follows:
Return on average tangible common shareholders’ equity
measures our earnings contribution as a percentage of adjusted
common shareholders’ equity. The tangible common equity ratio
represents adjusted ending common shareholders’ equity
divided by total assets less goodwill and intangible assets
(excluding MSRs), net of related deferred tax liabilities.
ROTE measures our earnings contribution as a percentage of
adjusted average total shareholders’ equity. The tangible equity
ratio represents adjusted ending shareholders’ equity divided
by total assets less goodwill and intangible assets (excluding
MSRs), net of related deferred tax liabilities.
Tangible book value per common share represents adjusted
ending common shareholders’ equity divided by ending common
shares outstanding.
The aforementioned supplemental data and performance
measures are presented in Table 7 and Statistical Table XII. In
addition, in Table 8, we have excluded the impact of goodwill
impairment charges of $3.2 billion and $12.4 billion recorded in
2011 and 2010 when presenting certain of these metrics.
Accordingly, these are non-GAAP financial measures.
We evaluate our business segment results based on measures
that utilize return on average allocated capital, and prior to January
1, 2013, the return on average economic capital, both of which
represent non-GAAP financial measures. These ratios are
calculated as net income adjusted for cost of funds and earnings
credits and certain expenses related to intangibles, divided by
average allocated capital or average economic capital, as
applicable. In addition, for purposes of goodwill impairment
testing, the Corporation utilizes allocated equity as a proxy for the
carrying value of its reporting units. Allocated equity for the
business segments is comprised of allocated capital (or economic
capital prior to 2013) plus capital for the portion of goodwill and
intangibles specifically assigned to the business segment. For
additional information, see Business Segment Operations on page
31 and Note 8 – Goodwill and Intangible Assets to the Consolidated
Financial Statements.
In 2009, Common Equivalent Securities were reflected in our
reconciliations given the expectation that the underlying Common
Equivalent Junior Preferred Stock, Series S would convert into
common stock following shareholder approval of additional
authorized shares. Shareholders approved the increase in the
number of authorized shares of common stock and the Common
Equivalent Stock converted into common stock on February 24,
2010.
Statistical Tables XV, XVI and XVII on pages 139, 140 and 141
provide reconciliations of these non-GAAP financial measures to
GAAP financial measures. We believe the use of these non-GAAP
financial measures provides additional clarity in assessing the
results of the Corporation and our segments. Other companies
may define or calculate these measures and ratios differently.
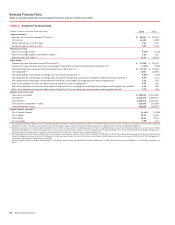
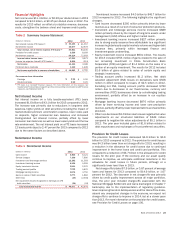
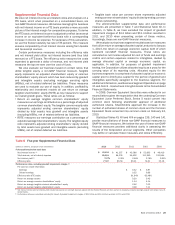
Table 8 Five-year Supplemental Financial Data
(Dollars in millions, except per share information) 2013 2012 2011 2010 2009
Fully taxable-equivalent basis data
Net interest income (1) $ 43,124 $ 41,557 $ 45,588 $ 52,693 $ 48,410
Total revenue, net of interest expense 89,801 84,235 94,426 111,390 120,944
Net interest yield (1) 2.47%2.35% 2.48% 2.78% 2.65%
Efficiency ratio 77.07 85.59 85.01 74.61 55.16
Performance ratios, excluding goodwill impairment charges (2)
Per common share information
Earnings $ 0.32 $ 0.87
Diluted earnings 0.32 0.86
Efficiency ratio (FTE basis) 81.64% 63.48%
Return on average assets 0.20 0.42
Return on average common shareholders’ equity 1.54 4.14
Return on average tangible common shareholders’ equity 2.46 7.03
Return on average tangible shareholders’ equity 3.08 7.11
(1) Net interest income and net interest yield include fees earned on overnight deposits placed with the Federal Reserve and fees earned on deposits, primarily overnight, placed with certain non-U.S.
central banks.
(2) Performance ratios are calculated excluding the impact of goodwill impairment charges of $3.2 billion and $12.4 billion recorded in 2011 and 2010.