Bank of America 2013 Annual Report Download - page 257
Download and view the complete annual report
Please find page 257 of the 2013 Bank of America annual report below. You can navigate through the pages in the report by either clicking on the pages listed below, or by using the keyword search tool below to find specific information within the annual report.-
 1
1 -
2
-
3
-
4
-
5
-
6
-
7
-
8
-
9
-
10
-
11
-
12
-
13
-
14
-
15
-
16
-
17
-
18
-
19
-
20
-
21
-
22
-
23
-
24
-
25
-
26
-
27
-
28
-
29
-
30
-
31
-
32
-
33
-
34
-
35
-
36
-
37
-
38
-
39
-
40
-
41
-
42
-
43
-
44
-
45
-
46
-
47
-
48
-
49
-
50
-
51
-
52
-
53
-
54
-
55
-
56
-
57
-
58
-
59
-
60
-
61
-
62
-
63
-
64
-
65
-
66
-
67
-
68
-
69
-
70
-
71
-
72
-
73
-
74
-
75
-
76
-
77
-
78
-
79
-
80
-
81
-
82
-
83
-
84
-
85
-
86
-
87
-
88
-
89
-
90
-
91
-
92
-
93
-
94
-
95
-
96
-
97
-
98
-
99
-
100
-
101
-
102
-
103
-
104
-
105
-
106
-
107
-
108
-
109
-
110
-
111
-
112
-
113
-
114
-
115
-
116
-
117
-
118
-
119
-
120
-
121
-
122
-
123
-
124
-
125
-
126
-
127
-
128
-
129
-
130
-
131
-
132
-
133
-
134
-
135
-
136
-
137
-
138
-
139
-
140
-
141
-
142
-
143
-
144
-
145
-
146
-
147
-
148
-
149
-
150
-
151
-
152
-
153
-
154
-
155
-
156
-
157
-
158
-
159
-
160
-
161
-
162
-
163
-
164
-
165
-
166
-
167
-
168
-
169
-
170
-
171
-
172
-
173
-
174
-
175
-
176
-
177
-
178
-
179
-
180
-
181
-
182
-
183
-
184
-
185
-
186
-
187
-
188
-
189
-
190
-
191
-
192
-
193
-
194
-
195
-
196
-
197
-
198
-
199
-
200
-
201
-
202
-
203
-
204
-
205
-
206
-
207
-
208
-
209
-
210
-
211
-
212
-
213
-
214
-
215
-
216
-
217
-
218
-
219
-
220
-
221
-
222
-
223
-
224
-
225
-
226
-
227
-
228
-
229
-
230
-
231
-
232
-
233
-
234
-
235
-
236
-
237
-
238
-
239
-
240
-
241
-
242
-
243
-
244
-
245
-
246
-
 247
247 -
 248
248 -
 249
249 -
 250
250 -
 251
251 -
 252
252 -
 253
253 -
 254
254 -
 255
255 -
 256
256 -
 257
257 -
 258
258 -
 259
259 -
 260
260 -
 261
261 -
 262
262 -
 263
263 -
 264
264 -
 265
265 -
 266
266 -
 267
267 -
268
-
269
-
270
-
271
-
272
-
273
-
274
-
275
-
276
-
277
-
278
-
279
-
280
-
281
-
282
-
283
-
284
 |
 |

Bank of America 2013 255
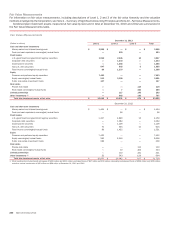
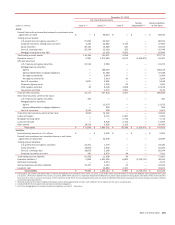
December 31, 2012
Fair Value Measurements
(Dollars in millions) Level 1 (1) Level 2 (1) Level 3
Netting
Adjustments (2)
Assets/Liabilities
at Fair Value
Assets
Federal funds sold and securities borrowed or purchased under
agreements to resell $ — $ 98,670 $ — $ — $ 98,670
Trading account assets:
U.S. government and agency securities (3) 57,655 29,319 — — 86,974
Corporate securities, trading loans and other 1,292 32,882 3,726 — 37,900
Equity securities 28,144 14,626 545 — 43,315
Non-U.S. sovereign debt 29,254 13,139 353 — 42,746
Mortgage trading loans and ABS — 11,905 4,935 — 16,840
Total trading account assets 116,345 101,871 9,559 — 227,775
Derivative assets (4) 2,997 1,372,398 8,073 (1,329,971) 53,497
AFS debt securities:
U.S. Treasury and agency securities 21,514 2,958 — — 24,472
Mortgage-backed securities:
Agency — 188,149 — — 188,149
Agency-collateralized mortgage obligations — 37,538 — — 37,538
Non-agency residential — 9,494 — — 9,494
Non-agency commercial — 3,914 10 — 3,924
Non-U.S. securities 2,637 2,981 — — 5,618
Corporate/Agency bonds — 1,358 92 — 1,450
Other taxable securities 20 8,180 3,928 — 12,128
Tax-exempt securities — 3,072 1,061 — 4,133
Total AFS debt securities 24,171 257,644 5,091 — 286,906
Other debt securities carried at fair value:
U.S. Treasury and agency securities 491 — — — 491
Mortgage-backed securities:
Agency — 13,073 — — 13,073
Agency-collateralized mortgage obligations — 929 — — 929
Non-U.S. securities 9,151 300 — — 9,451
Total other debt securities carried at fair value 9,642 14,302 — — 23,944
Loans and leases — 6,715 2,287 — 9,002
Mortgage servicing rights — — 5,716 — 5,716
Loans held-for-sale — 8,926 2,733 — 11,659
Other assets 18,535 4,826 3,129 — 26,490
Total assets $171,690 $ 1,865,352 $ 36,588 $ (1,329,971) $ 743,659
Liabilities
Interest-bearing deposits in U.S. offices $ — $ 2,262 $ — $ — $ 2,262
Federal funds purchased and securities loaned or sold under
agreements to repurchase — 42,639 — — 42,639
Trading account liabilities:
U.S. government and agency securities 22,351 1,079 — — 23,430
Equity securities 19,852 2,640 — — 22,492
Non-U.S. sovereign debt 18,875 1,369 — — 20,244
Corporate securities and other 487 6,870 64 — 7,421
Total trading account liabilities 61,565 11,958 64 — 73,587
Derivative liabilities (4) 2,859 1,355,309 6,605 (1,318,757) 46,016
Short-term borrowings — 4,074 — — 4,074
Accrued expenses and other liabilities 15,457 1,122 15 — 16,594
Long-term debt — 46,860 2,301 — 49,161
Total liabilities $ 79,881 $ 1,464,224 $ 8,985 $ (1,318,757) $ 234,333
(1) During 2012, $2.0 billion and $350 million of assets and liabilities were transferred from Level 1 to Level 2, and $785 million and $40 million of assets and liabilities were transferred from Level
2 to Level 1. Of the asset transfers from Level 1 to Level 2, $940 million was due to a restriction that became effective for a private equity investment during 2012, while $535 million of the transfers
from Level 2 to Level 1 was due to the lapse of this restriction during 2012. The remaining transfers were the result of additional information associated with certain equities, derivative contracts
and private equity investments.
(2) Amounts represent the impact of legally enforceable master netting agreements and also cash collateral held or placed with the same counterparties.
(3) Includes $30.6 billion of government-sponsored enterprise obligations.
(4) For further disaggregation of derivative assets and liabilities, see Note 2 – Derivatives.