Bank of America 2013 Annual Report Download - page 79
Download and view the complete annual report
Please find page 79 of the 2013 Bank of America annual report below. You can navigate through the pages in the report by either clicking on the pages listed below, or by using the keyword search tool below to find specific information within the annual report.-
 1
1 -
2
-
3
-
4
-
5
-
6
-
7
-
8
-
9
-
10
-
11
-
12
-
13
-
14
-
15
-
16
-
17
-
18
-
19
-
20
-
21
-
22
-
23
-
24
-
25
-
26
-
27
-
28
-
29
-
30
-
31
-
32
-
33
-
34
-
35
-
36
-
37
-
38
-
39
-
40
-
41
-
42
-
43
-
44
-
45
-
46
-
47
-
48
-
49
-
50
-
51
-
52
-
53
-
54
-
55
-
56
-
57
-
58
-
59
-
60
-
61
-
62
-
63
-
64
-
65
-
66
-
67
-
68
-
 69
69 -
 70
70 -
 71
71 -
 72
72 -
 73
73 -
 74
74 -
 75
75 -
 76
76 -
 77
77 -
 78
78 -
 79
79 -
 80
80 -
 81
81 -
 82
82 -
 83
83 -
 84
84 -
 85
85 -
 86
86 -
 87
87 -
 88
88 -
 89
89 -
90
-
91
-
92
-
93
-
94
-
95
-
96
-
97
-
98
-
99
-
100
-
101
-
102
-
103
-
104
-
105
-
106
-
107
-
108
-
109
-
110
-
111
-
112
-
113
-
114
-
115
-
116
-
117
-
118
-
119
-
120
-
121
-
122
-
123
-
124
-
125
-
126
-
127
-
128
-
129
-
130
-
131
-
132
-
133
-
134
-
135
-
136
-
137
-
138
-
139
-
140
-
141
-
142
-
143
-
144
-
145
-
146
-
147
-
148
-
149
-
150
-
151
-
152
-
153
-
154
-
155
-
156
-
157
-
158
-
159
-
160
-
161
-
162
-
163
-
164
-
165
-
166
-
167
-
168
-
169
-
170
-
171
-
172
-
173
-
174
-
175
-
176
-
177
-
178
-
179
-
180
-
181
-
182
-
183
-
184
-
185
-
186
-
187
-
188
-
189
-
190
-
191
-
192
-
193
-
194
-
195
-
196
-
197
-
198
-
199
-
200
-
201
-
202
-
203
-
204
-
205
-
206
-
207
-
208
-
209
-
210
-
211
-
212
-
213
-
214
-
215
-
216
-
217
-
218
-
219
-
220
-
221
-
222
-
223
-
224
-
225
-
226
-
227
-
228
-
229
-
230
-
231
-
232
-
233
-
234
-
235
-
236
-
237
-
238
-
239
-
240
-
241
-
242
-
243
-
244
-
245
-
246
-
247
-
248
-
249
-
250
-
251
-
252
-
253
-
254
-
255
-
256
-
257
-
258
-
259
-
260
-
261
-
262
-
263
-
264
-
265
-
266
-
267
-
268
-
269
-
270
-
271
-
272
-
273
-
274
-
275
-
276
-
277
-
278
-
279
-
280
-
281
-
282
-
283
-
284
 |
 |

Bank of America 2013 77
long-term stand-by agreements. At December 31, 2013 and 2012,
$22.5 billion and $25.5 billion of the FHA-insured loan population
were repurchases of delinquent FHA loans pursuant to our
servicing agreements with GNMA. All of these loans are individually
insured and therefore the Corporation does not record a significant
allowance for credit losses with respect to these loans.
In addition to the long-term stand-by agreements with FNMA
and FHLMC, we have mitigated a portion of our credit risk on the
residential mortgage portfolio through the use of synthetic
securitization vehicles as described in Note 4 – Outstanding Loans
and Leases to the Consolidated Financial Statements. At
December 31, 2013 and 2012, the synthetic securitization
vehicles referenced principal balances of $12.5 billion and $17.6
billion of residential mortgage loans and provided loss protection
up to $339 million and $500 million. At December 31, 2013 and
2012, the Corporation had a receivable of $198 million and $305
million from these vehicles for reimbursement of losses. The
Corporation records an allowance for credit losses on loans
referenced by the synthetic securitization vehicles. The reported
net charge-offs for the residential mortgage portfolio do not include
the benefit of amounts reimbursable from these vehicles.
Adjusting for the benefit of the credit protection from the synthetic
securitizations, the residential mortgage net charge-off ratio,
excluding the PCI and fully-insured loan portfolios, in 2013 and
2012 would have been reduced by three bps and nine bps.
The long-term stand-by agreements with FNMA and FHLMC and
to a lesser extent the synthetic securitizations together reduce our
regulatory risk-weighted assets due to the transfer of a portion of
our credit risk to unaffiliated parties. At December 31, 2013 and
2012, these programs had the cumulative effect of reducing our
risk-weighted assets by $8.4 billion and $7.2 billion and
increasing our Tier 1 capital ratio by eight bps and increasing our
Tier 1 common capital ratio by seven bps at both year ends.
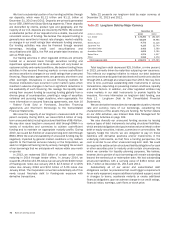
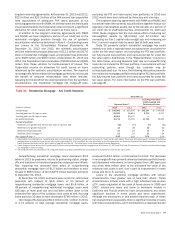
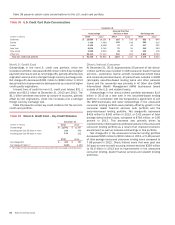
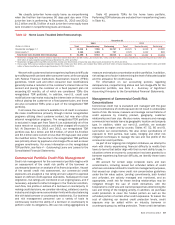
Table 30 presents certain residential mortgage key credit
statistics on both a reported basis excluding loans accounted for
under the fair value option, and excluding the PCI loan portfolio,
our fully-insured loan portfolio and loans accounted for under the
fair value option. Additionally, in the “Reported Basis” columns in
the table below, accruing balances past due and nonperforming
loans do not include the PCI loan portfolio, in accordance with our
accounting policies, even though the customer may be
contractually past due. As such, the following discussion presents
the residential mortgage portfolio excluding the PCI loan portfolio,
the fully-insured loan portfolio and loans accounted for under the
fair value option. For more information on the PCI loan portfolio,
see page 81.
Table 30 Residential Mortgage – Key Credit Statistics
December 31
Reported Basis (1)
Excluding Purchased
Credit-impaired and
Fully-insured Loans
(Dollars in millions) 2013 2012 2013 2012
Outstandings $ 248,066 $ 252,929 $ 142,147 $ 144,624
Accruing past due 30 days or more 23,052 28,815 2,371 3,117
Accruing past due 90 days or more 16,961 22,157 ——
Nonperforming loans 11,712 15,055 11,712 15,055
Percent of portfolio
Refreshed LTV greater than 90 but less than or equal to 100 12% 15% 7% 10%
Refreshed LTV greater than 100 13 28 10 20
Refreshed FICO below 620 21 23 11 14
2006 and 2007 vintages (2) 21 25 27 34
Net charge-off ratio (3) 0.42 1.18 0.74 2.04
(1) Outstandings, accruing past due, nonperforming loans and percentages of portfolio exclude loans accounted for under the fair value option. There were $2.0 billion and $1.0 billion of residential
mortgage loans accounted for under the fair value option at December 31, 2013 and 2012. For more information on the fair value option, see Consumer Portfolio Credit Risk Management – Consumer
Loans Accounted for Under the Fair Value Option on page 85 and Note 21 – Fair Value Option to the Consolidated Financial Statements.
(2) These vintages of loans account for 53 percent and 61 percent of nonperforming residential mortgage loans at December 31, 2013 and 2012, and 60 percent and 71 percent of residential mortgage
net charge-offs in 2013 and 2012.
(3) Net charge-off ratios are calculated as net charge-offs divided by average outstanding loans excluding loans accounted for under the fair value option.
Nonperforming residential mortgage loans decreased $3.3
billion in 2013 as paydowns, returns to performing status, charge-
offs and transfers to foreclosed properties outpaced new inflows.
Also impacting the decrease were sales of nonperforming
residential mortgage loans of $1.5 billion and transfers to held-
for-sale of $663 million, of which $273 million had been sold prior
to December 31, 2013.
At December 31, 2013, borrowers were current on contractual
payments with respect to $3.9 billion, or 34 percent of
nonperforming residential mortgage loans, and $5.8 billion, or
49 percent of nonperforming residential mortgage loans were
180 days or more past due and had been written down to the
estimated fair value of the collateral less costs to sell. Accruing
loans past due 30 days or more decreased $746 million in 2013.
Net charge-offs decreased $2.0 billion to $1.1 billion in 2013,
or 0.74 percent of total average residential mortgage loans,
compared to $3.1 billion, or 2.04 percent in 2012. This decrease
in net charge-offs was primarily driven by favorable portfolio trends
and decreased write-downs on loans greater than 180 days past
due which were written down to the estimated fair value of the
collateral less costs to sell, due in part to improvement in home
prices and the U.S. economy.
Loans in the residential mortgage portfolio with certain
characteristics have greater risk of loss than others. These
characteristics include loans with a high refreshed loan-to-value
(LTV), loans originated at the peak of home prices in 2006 and
2007, interest-only loans and loans to borrowers located in
California and Florida where we have concentrations and where
significant declines in home prices had been experienced.
Although the disclosures in this section address each of these
risk characteristics separately, there is significant overlap in loans
with these characteristics, which contributed to a disproportionate