Bank of America 2013 Annual Report Download - page 93
Download and view the complete annual report
Please find page 93 of the 2013 Bank of America annual report below. You can navigate through the pages in the report by either clicking on the pages listed below, or by using the keyword search tool below to find specific information within the annual report.-
 1
1 -
2
-
3
-
4
-
5
-
6
-
7
-
8
-
9
-
10
-
11
-
12
-
13
-
14
-
15
-
16
-
17
-
18
-
19
-
20
-
21
-
22
-
23
-
24
-
25
-
26
-
27
-
28
-
29
-
30
-
31
-
32
-
33
-
34
-
35
-
36
-
37
-
38
-
39
-
40
-
41
-
42
-
43
-
44
-
45
-
46
-
47
-
48
-
49
-
50
-
51
-
52
-
53
-
54
-
55
-
56
-
57
-
58
-
59
-
60
-
61
-
62
-
63
-
64
-
65
-
66
-
67
-
68
-
69
-
70
-
71
-
72
-
73
-
74
-
75
-
76
-
77
-
78
-
79
-
80
-
81
-
82
-
 83
83 -
 84
84 -
 85
85 -
 86
86 -
 87
87 -
 88
88 -
 89
89 -
 90
90 -
 91
91 -
 92
92 -
 93
93 -
 94
94 -
 95
95 -
 96
96 -
 97
97 -
 98
98 -
 99
99 -
 100
100 -
 101
101 -
 102
102 -
 103
103 -
104
-
105
-
106
-
107
-
108
-
109
-
110
-
111
-
112
-
113
-
114
-
115
-
116
-
117
-
118
-
119
-
120
-
121
-
122
-
123
-
124
-
125
-
126
-
127
-
128
-
129
-
130
-
131
-
132
-
133
-
134
-
135
-
136
-
137
-
138
-
139
-
140
-
141
-
142
-
143
-
144
-
145
-
146
-
147
-
148
-
149
-
150
-
151
-
152
-
153
-
154
-
155
-
156
-
157
-
158
-
159
-
160
-
161
-
162
-
163
-
164
-
165
-
166
-
167
-
168
-
169
-
170
-
171
-
172
-
173
-
174
-
175
-
176
-
177
-
178
-
179
-
180
-
181
-
182
-
183
-
184
-
185
-
186
-
187
-
188
-
189
-
190
-
191
-
192
-
193
-
194
-
195
-
196
-
197
-
198
-
199
-
200
-
201
-
202
-
203
-
204
-
205
-
206
-
207
-
208
-
209
-
210
-
211
-
212
-
213
-
214
-
215
-
216
-
217
-
218
-
219
-
220
-
221
-
222
-
223
-
224
-
225
-
226
-
227
-
228
-
229
-
230
-
231
-
232
-
233
-
234
-
235
-
236
-
237
-
238
-
239
-
240
-
241
-
242
-
243
-
244
-
245
-
246
-
247
-
248
-
249
-
250
-
251
-
252
-
253
-
254
-
255
-
256
-
257
-
258
-
259
-
260
-
261
-
262
-
263
-
264
-
265
-
266
-
267
-
268
-
269
-
270
-
271
-
272
-
273
-
274
-
275
-
276
-
277
-
278
-
279
-
280
-
281
-
282
-
283
-
284
 |
 |

Bank of America 2013 91
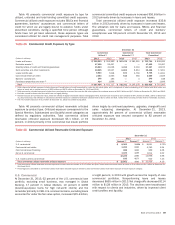
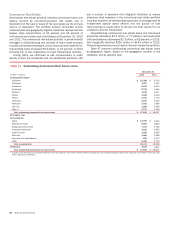
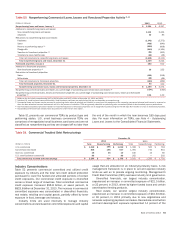
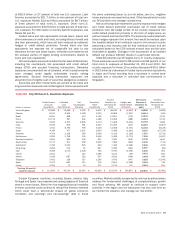
Tables 48 and 49 present commercial real estate credit quality
data by non-residential and residential property types. The
residential portfolio presented in Tables 47, 48 and 49 includes
condominiums and other residential real estate. Other property
types in Tables 47, 48 and 49 primarily include special purpose,
nursing/retirement homes, medical facilities and restaurants, as
well as unsecured loans to borrowers whose primary business is
commercial real estate.
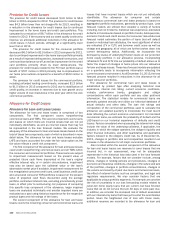
Table 48 Commercial Real Estate Credit Quality Data
December 31
Nonperforming Loans and
Foreclosed Properties (1)
Utilized Reservable
Criticized Exposure (2)
(Dollars in millions) 2013 2012 2013 2012
Non-residential
Office $96
$ 295 $367 $ 914
Multi-family rental 15 109 234 375
Shopping centers/retail 57 230 144 464
Industrial/warehouse 22 160 119 324
Hotels/motels 545 38 202
Multi-use 19 123 157 309
Land and land development 73 321 92 359
Other 23 87 173 301
Total non-residential 310 1,370 1,324 3,248
Residential 102 393 128 534
Total commercial real estate $ 412 $ 1,763 $ 1,452 $ 3,782
(1) Includes commercial foreclosed properties of $90 million and $250 million at December 31, 2013 and 2012.
(2) Includes loans, SBLCs and bankers’ acceptances and excludes loans accounted for under the fair value option.
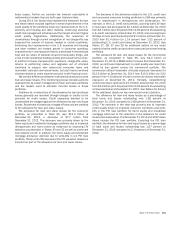
Table 49 Commercial Real Estate Net Charge-offs and Related Ratios
Net Charge-offs Net Charge-off Ratios (1)
(Dollars in millions) 2013 2012 2013 2012
Non-residential
Office $42
$ 106 0.39%1.36%
Multi-family rental 213 0.02 0.23
Shopping centers/retail 12 57 0.18 1.00
Industrial/warehouse 23 49 0.55 1.31
Hotels/motels 18 11 0.52 0.39
Multi-use 566 0.26 2.46
Land and land development 23 (23) 2.35 (1.73)
Other (23) 31 (0.41) 0.51
Total non-residential 102 310 0.25 0.86
Residential 47 74 3.04 3.74
Total commercial real estate $ 149 $ 384 0.35 1.01
(1) Net charge-off ratios are calculated as net charge-offs divided by average outstanding loans excluding loans accounted for under the fair value option.
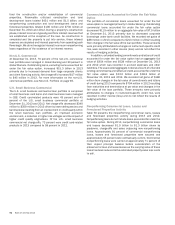
At December 31, 2013, total committed non-residential
exposure was $68.6 billion compared to $54.5 billion at
December 31, 2012, of which $46.4 billion and $37.0 billion were
funded secured loans. Non-residential nonperforming loans and
foreclosed properties declined $1.1 billion, or 77 percent, to $310
million at December 31, 2013 compared to $1.4 billion at
December 31, 2012, which represented 0.67 percent and 3.68
percent of total non-residential loans and foreclosed properties.
The decline in nonperforming loans and foreclosed properties in
the non-residential portfolio was driven by decreases across all
property types. Non-residential utilized reservable criticized
exposure decreased $1.9 billion, or 59 percent, to $1.3 billion at
December 31, 2013 compared to $3.2 billion at December 31,
2012, which represented 2.75 percent and 8.27 percent of non-
residential utilized reservable exposure, with the decrease
primarily due to continued resolution of legacy criticized exposure.
The decrease in reservable criticized exposure was driven by
decreases across all property types. For the non-residential
portfolio, net charge-offs decreased $208 million to $102 million
in 2013 primarily due to lower overall levels of criticized and
nonperforming assets.
At December 31, 2013, total committed residential exposure
was $3.1 billion compared to $3.2 billion at December 31, 2012,
of which $1.5 billion and $1.6 billion were funded secured loans.
Residential nonperforming loans and foreclosed properties
decreased $291 million, or 74 percent, in 2013 due to repayments,
sales and loan restructuring. Residential utilized reservable
criticized exposure decreased $406 million, or 76 percent, during
2013 due to continued resolution of criticized exposure. The
nonperforming loans, leases and foreclosed properties and the
utilized reservable criticized ratios for the residential portfolio were
6.65 percent and 7.81 percent at December 31, 2013 compared
to 23.33 percent and 31.56 percent at December 31, 2012.
Residential portfolio net charge-offs decreased $27 million in
2013 compared to 2012.
At December 31, 2013 and 2012, the commercial real estate
loan portfolio included $7.0 billion and $6.7 billion of funded
construction and land development loans that were originated to