Bank of America 2013 Annual Report Download - page 30
Download and view the complete annual report
Please find page 30 of the 2013 Bank of America annual report below. You can navigate through the pages in the report by either clicking on the pages listed below, or by using the keyword search tool below to find specific information within the annual report.-
 1
1 -
2
-
3
-
4
-
5
-
6
-
7
-
8
-
9
-
10
-
11
-
12
-
13
-
14
-
15
-
16
-
17
-
18
-
19
-
 20
20 -
 21
21 -
 22
22 -
 23
23 -
 24
24 -
 25
25 -
 26
26 -
 27
27 -
 28
28 -
 29
29 -
 30
30 -
 31
31 -
 32
32 -
 33
33 -
 34
34 -
 35
35 -
 36
36 -
 37
37 -
 38
38 -
 39
39 -
 40
40 -
41
-
42
-
43
-
44
-
45
-
46
-
47
-
48
-
49
-
50
-
51
-
52
-
53
-
54
-
55
-
56
-
57
-
58
-
59
-
60
-
61
-
62
-
63
-
64
-
65
-
66
-
67
-
68
-
69
-
70
-
71
-
72
-
73
-
74
-
75
-
76
-
77
-
78
-
79
-
80
-
81
-
82
-
83
-
84
-
85
-
86
-
87
-
88
-
89
-
90
-
91
-
92
-
93
-
94
-
95
-
96
-
97
-
98
-
99
-
100
-
101
-
102
-
103
-
104
-
105
-
106
-
107
-
108
-
109
-
110
-
111
-
112
-
113
-
114
-
115
-
116
-
117
-
118
-
119
-
120
-
121
-
122
-
123
-
124
-
125
-
126
-
127
-
128
-
129
-
130
-
131
-
132
-
133
-
134
-
135
-
136
-
137
-
138
-
139
-
140
-
141
-
142
-
143
-
144
-
145
-
146
-
147
-
148
-
149
-
150
-
151
-
152
-
153
-
154
-
155
-
156
-
157
-
158
-
159
-
160
-
161
-
162
-
163
-
164
-
165
-
166
-
167
-
168
-
169
-
170
-
171
-
172
-
173
-
174
-
175
-
176
-
177
-
178
-
179
-
180
-
181
-
182
-
183
-
184
-
185
-
186
-
187
-
188
-
189
-
190
-
191
-
192
-
193
-
194
-
195
-
196
-
197
-
198
-
199
-
200
-
201
-
202
-
203
-
204
-
205
-
206
-
207
-
208
-
209
-
210
-
211
-
212
-
213
-
214
-
215
-
216
-
217
-
218
-
219
-
220
-
221
-
222
-
223
-
224
-
225
-
226
-
227
-
228
-
229
-
230
-
231
-
232
-
233
-
234
-
235
-
236
-
237
-
238
-
239
-
240
-
241
-
242
-
243
-
244
-
245
-
246
-
247
-
248
-
249
-
250
-
251
-
252
-
253
-
254
-
255
-
256
-
257
-
258
-
259
-
260
-
261
-
262
-
263
-
264
-
265
-
266
-
267
-
268
-
269
-
270
-
271
-
272
-
273
-
274
-
275
-
276
-
277
-
278
-
279
-
280
-
281
-
282
-
283
-
284
 |
 |

28 Bank of America 2013
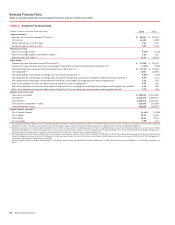
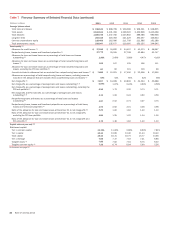
Table 7 Five-year Summary of Selected Financial Data (continued)
(Dollars in millions) 2013 2012 2011 2010 2009
Average balance sheet
Total loans and leases $ 918,641 $ 898,768 $ 938,096 $ 958,331 $ 948,805
Total assets 2,163,513 2,191,356 2,296,322 2,439,606 2,443,068
Total deposits 1,089,735 1,047,782 1,035,802 988,586 980,966
Long-term debt 263,416 316,393 421,229 490,497 446,634
Common shareholders’ equity 218,468 216,996 211,709 212,686 182,288
Total shareholders’ equity 233,947 235,677 229,095 233,235 244,645
Asset quality (4)
Allowance for credit losses (5) $ 17,912 $ 24,692 $ 34,497 $ 43,073 $ 38,687
Nonperforming loans, leases and foreclosed properties (6) 17,772 23,555 27,708 32,664 35,747
Allowance for loan and lease losses as a percentage of total loans and leases
outstanding (6) 1.90%2.69% 3.68% 4.47% 4.16%
Allowance for loan and lease losses as a percentage of total nonperforming loans and
leases (6) 102 107 135 136 111
Allowance for loan and lease losses as a percentage of total nonperforming loans and
leases, excluding the PCI loan portfolio (6) 87 82 101 116 99
Amounts included in allowance that are excluded from nonperforming loans and leases (7) $ 7,680 $ 12,021 $ 17,490 $ 22,908 $ 17,690
Allowance as a percentage of total nonperforming loans and leases, excluding amounts
included in the allowance that are excluded from nonperforming loans and leases (7) 57% 54% 65% 62% 58%
Net charge-offs (8) $ 7,897 $ 14,908 $ 20,833 $ 34,334 $ 33,688
Net charge-offs as a percentage of average loans and leases outstanding (6, 8) 0.87%1.67% 2.24% 3.60% 3.58%
Net charge-offs as a percentage of average loans and leases outstanding, excluding the
PCI loan portfolio (6) 0.90 1.73 2.32 3.73 3.71
Net charge-offs and PCI write-offs as a percentage of average loans and leases
outstanding (6, 9) 1.13 1.99 2.24 3.60 3.58
Nonperforming loans and leases as a percentage of total loans and leases
outstanding (6) 1.87 2.52 2.74 3.27 3.75
Nonperforming loans, leases and foreclosed properties as a percentage of total loans,
leases and foreclosed properties (6) 1.93 2.62 3.01 3.48 3.98
Ratio of the allowance for loan and lease losses at December 31 to net charge-offs (8) 2.21 1.62 1.62 1.22 1.10
Ratio of the allowance for loan and lease losses at December 31 to net charge-offs,
excluding the PCI loan portfolio 1.89 1.25 1.22 1.04 1.00
Ratio of the allowance for loan and lease losses at December 31 to net charge-offs and
PCI write-offs (9) 1.70 1.36 1.62 1.22 1.10
Capital ratios at year end (10)
Risk-based capital:
Tier 1 common capital 11.19% 11.06% 9.86% 8.60% 7.81%
Tier 1 capital 12.44 12.89 12.40 11.24 10.40
Total capital 15.44 16.31 16.75 15.77 14.66
Tier 1 leverage 7.86 7.37 7.53 7.21 6.88
Tangible equity (3) 7.86 7.62 7.54 6.75 6.40
Tangible common equity (3) 7.20 6.74 6.64 5.99 5.56
For footnotes see page 27.