Bank of America 2013 Annual Report Download - page 133
Download and view the complete annual report
Please find page 133 of the 2013 Bank of America annual report below. You can navigate through the pages in the report by either clicking on the pages listed below, or by using the keyword search tool below to find specific information within the annual report.-
 1
1 -
2
-
3
-
4
-
5
-
6
-
7
-
8
-
9
-
10
-
11
-
12
-
13
-
14
-
15
-
16
-
17
-
18
-
19
-
20
-
21
-
22
-
23
-
24
-
25
-
26
-
27
-
28
-
29
-
30
-
31
-
32
-
33
-
34
-
35
-
36
-
37
-
38
-
39
-
40
-
41
-
42
-
43
-
44
-
45
-
46
-
47
-
48
-
49
-
50
-
51
-
52
-
53
-
54
-
55
-
56
-
57
-
58
-
59
-
60
-
61
-
62
-
63
-
64
-
65
-
66
-
67
-
68
-
69
-
70
-
71
-
72
-
73
-
74
-
75
-
76
-
77
-
78
-
79
-
80
-
81
-
82
-
83
-
84
-
85
-
86
-
87
-
88
-
89
-
90
-
91
-
92
-
93
-
94
-
95
-
96
-
97
-
98
-
99
-
100
-
101
-
102
-
103
-
104
-
105
-
106
-
107
-
108
-
109
-
110
-
111
-
112
-
113
-
114
-
115
-
116
-
117
-
118
-
119
-
120
-
121
-
122
-
 123
123 -
 124
124 -
 125
125 -
 126
126 -
 127
127 -
 128
128 -
 129
129 -
 130
130 -
 131
131 -
 132
132 -
 133
133 -
 134
134 -
 135
135 -
 136
136 -
 137
137 -
 138
138 -
 139
139 -
 140
140 -
 141
141 -
 142
142 -
 143
143 -
144
-
145
-
146
-
147
-
148
-
149
-
150
-
151
-
152
-
153
-
154
-
155
-
156
-
157
-
158
-
159
-
160
-
161
-
162
-
163
-
164
-
165
-
166
-
167
-
168
-
169
-
170
-
171
-
172
-
173
-
174
-
175
-
176
-
177
-
178
-
179
-
180
-
181
-
182
-
183
-
184
-
185
-
186
-
187
-
188
-
189
-
190
-
191
-
192
-
193
-
194
-
195
-
196
-
197
-
198
-
199
-
200
-
201
-
202
-
203
-
204
-
205
-
206
-
207
-
208
-
209
-
210
-
211
-
212
-
213
-
214
-
215
-
216
-
217
-
218
-
219
-
220
-
221
-
222
-
223
-
224
-
225
-
226
-
227
-
228
-
229
-
230
-
231
-
232
-
233
-
234
-
235
-
236
-
237
-
238
-
239
-
240
-
241
-
242
-
243
-
244
-
245
-
246
-
247
-
248
-
249
-
250
-
251
-
252
-
253
-
254
-
255
-
256
-
257
-
258
-
259
-
260
-
261
-
262
-
263
-
264
-
265
-
266
-
267
-
268
-
269
-
270
-
271
-
272
-
273
-
274
-
275
-
276
-
277
-
278
-
279
-
280
-
281
-
282
-
283
-
284
 |
 |

Bank of America 2013 131
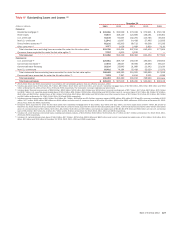
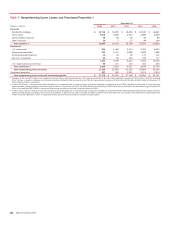
Table VII Allowance for Credit Losses (continued)
(Dollars in millions) 2013 2012 2011 2010 2009
Loan and allowance ratios:
Loans and leases outstanding at December 31 (6) $ 918,191 $ 898,817 $ 917,396 $ 937,119 $ 895,192
Allowance for loan and lease losses as a percentage of total loans and leases
outstanding at December 31 (6) 1.90%2.69% 3.68% 4.47% 4.16%
Consumer allowance for loan and lease losses as a percentage of total consumer loans
and leases outstanding at December 31 (7) 2.53 3.81 4.88 5.40 4.81
Commercial allowance for loan and lease losses as a percentage of total commercial
loans and leases outstanding at December 31 (8) 1.03 0.90 1.33 2.44 2.96
Average loans and leases outstanding (6) $ 909,127 $ 890,337 $ 929,661 $ 954,278 $ 941,862
Net charge-offs as a percentage of average loans and leases outstanding (6, 9) 0.87%1.67% 2.24% 3.60% 3.58%
Net charge-offs and PCI write-offs as a percentage of average loans and leases
outstanding (6, 10) 1.13 1.99 2.24 3.60 3.58
Allowance for loan and lease losses as a percentage of total nonperforming loans and
leases at December 31 (6, 11) 102 107 135 136 111
Ratio of the allowance for loan and lease losses at December 31 to net charge-offs (9) 2.21 1.62 1.62 1.22 1.10
Ratio of the allowance for loan and lease losses at December 31 to net charge-offs and
PCI write-offs (10) 1.70 1.36 1.62 1.22 1.10
Amounts included in allowance for loan and lease losses that are excluded from
nonperforming loans and leases at December 31 (12) $ 7,680 $ 12,021 $ 17,490 $ 22,908 $ 17,690
Allowance for loan and lease losses as a percentage of total nonperforming loans and
leases, excluding amounts included in the allowance for loan and lease losses that are
excluded from nonperforming loans and leases at December 31 (12) 57% 54% 65% 62% 58%
Loan and allowance ratios excluding PCI loans and the related valuation allowance: (13)
Allowance for loan and lease losses as a percentage of total loans and leases
outstanding at December 31 (6) 1.67%2.14% 2.86% 3.94% 3.88%
Consumer allowance for loan and lease losses as a percentage of total consumer loans
and leases outstanding at December 31 (7) 2.17 2.95 3.68 4.66 4.43
Net charge-offs as a percentage of average loans and leases outstanding (6) 0.90 1.73 2.32 3.73 3.71
Allowance for loan and lease losses as a percentage of total nonperforming loans and
leases at December 31 (6, 11) 87 82 101 116 99
Ratio of the allowance for loan and lease losses at December 31 to net charge-offs 1.89 1.25 1.22 1.04 1.00
(6) Outstanding loan and lease balances and ratios do not include loans accounted for under the fair value option, which were $10.0 billion, $9.0 billion, $8.8 billion, $3.3 billion and $4.9 billion at
December 31, 2013, 2012, 2011, 2010 and 2009, respectively. Average loans accounted for under the fair value option were $9.5 billion, $8.4 billion, $8.4 billion, $4.1 billion and $6.9 billion in
2013, 2012, 2011, 2010 and 2009, respectively.
(7) Excludes consumer loans accounted for under the fair value option of $2.2 billion, $1.0 billion and $2.2 billion at December 31, 2013, 2012 and 2011. There were no consumer loans accounted
for under the fair value option prior to 2011.
(8) Excludes commercial loans accounted for under the fair value option of $7.9 billion, $8.0 billion, $6.6 billion, $3.3 billion and $4.9 billion at December 31, 2013, 2012, 2011, 2010 and 2009,
respectively.
(9) Net charge-offs exclude $2.3 billion and $2.8 billion of write-offs in the PCI loan portfolio in 2013 and 2012. These write-offs decreased the PCI valuation allowance included as part of the allowance
for loan and lease losses. For more information on PCI write-offs, see Consumer Portfolio Credit Risk Management – Purchased Credit-impaired Loan Portfolio on page 81.
(10) There were no write-offs of PCI loans in 2011, 2010 and 2009.
(11) For more information on our definition of nonperforming loans, see pages 85 and 92.
(12) Primarily includes amounts allocated to the U.S. credit card and unsecured lending portfolios in CBB, PCI loans and the non-U.S. credit portfolio in All Other.
(13) For more information on the PCI loan portfolio and the valuation allowance for PCI loans, see Note 4 – Outstanding Loans and Leases and Note 5 – Allowance for Credit Losses to the Consolidated
Financial Statements.