Bank of America 2013 Annual Report Download - page 266
Download and view the complete annual report
Please find page 266 of the 2013 Bank of America annual report below. You can navigate through the pages in the report by either clicking on the pages listed below, or by using the keyword search tool below to find specific information within the annual report.-
 1
1 -
2
-
3
-
4
-
5
-
6
-
7
-
8
-
9
-
10
-
11
-
12
-
13
-
14
-
15
-
16
-
17
-
18
-
19
-
20
-
21
-
22
-
23
-
24
-
25
-
26
-
27
-
28
-
29
-
30
-
31
-
32
-
33
-
34
-
35
-
36
-
37
-
38
-
39
-
40
-
41
-
42
-
43
-
44
-
45
-
46
-
47
-
48
-
49
-
50
-
51
-
52
-
53
-
54
-
55
-
56
-
57
-
58
-
59
-
60
-
61
-
62
-
63
-
64
-
65
-
66
-
67
-
68
-
69
-
70
-
71
-
72
-
73
-
74
-
75
-
76
-
77
-
78
-
79
-
80
-
81
-
82
-
83
-
84
-
85
-
86
-
87
-
88
-
89
-
90
-
91
-
92
-
93
-
94
-
95
-
96
-
97
-
98
-
99
-
100
-
101
-
102
-
103
-
104
-
105
-
106
-
107
-
108
-
109
-
110
-
111
-
112
-
113
-
114
-
115
-
116
-
117
-
118
-
119
-
120
-
121
-
122
-
123
-
124
-
125
-
126
-
127
-
128
-
129
-
130
-
131
-
132
-
133
-
134
-
135
-
136
-
137
-
138
-
139
-
140
-
141
-
142
-
143
-
144
-
145
-
146
-
147
-
148
-
149
-
150
-
151
-
152
-
153
-
154
-
155
-
156
-
157
-
158
-
159
-
160
-
161
-
162
-
163
-
164
-
165
-
166
-
167
-
168
-
169
-
170
-
171
-
172
-
173
-
174
-
175
-
176
-
177
-
178
-
179
-
180
-
181
-
182
-
183
-
184
-
185
-
186
-
187
-
188
-
189
-
190
-
191
-
192
-
193
-
194
-
195
-
196
-
197
-
198
-
199
-
200
-
201
-
202
-
203
-
204
-
205
-
206
-
207
-
208
-
209
-
210
-
211
-
212
-
213
-
214
-
215
-
216
-
217
-
218
-
219
-
220
-
221
-
222
-
223
-
224
-
225
-
226
-
227
-
228
-
229
-
230
-
231
-
232
-
233
-
234
-
235
-
236
-
237
-
238
-
239
-
240
-
241
-
242
-
243
-
244
-
245
-
246
-
247
-
248
-
249
-
250
-
251
-
252
-
253
-
254
-
255
-
 256
256 -
 257
257 -
 258
258 -
 259
259 -
 260
260 -
 261
261 -
 262
262 -
 263
263 -
 264
264 -
 265
265 -
 266
266 -
 267
267 -
 268
268 -
 269
269 -
 270
270 -
 271
271 -
 272
272 -
 273
273 -
 274
274 -
 275
275 -
 276
276 -
277
-
278
-
279
-
280
-
281
-
282
-
283
-
284
 |
 |
264 Bank of America 2013
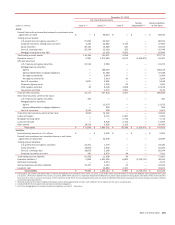
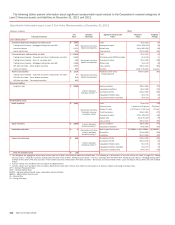
In the tables above, instruments backed by residential and
commercial real estate assets include RMBS, CMBS, whole loans,
mortgage CDOs and net monoline exposure. Commercial loans,
debt securities and other includes corporate CLOs and CDOs,
commercial loans and bonds, and securities backed by non-real
estate assets. Structured liabilities primarily include equity-linked
notes that are accounted for under the fair value option.
In addition to the instruments in the tables above, the
Corporation held $767 million and $1.2 billion of instruments at
December 31, 2013 and 2012 consisting primarily of certain direct
private equity investments and private equity funds that were
classified as Level 3 and reported within other assets. Valuations
of direct private equity investments are based on the most recent
company financial information. Inputs generally include market
and acquisition comparables, entry level multiples, as well as other
variables. The Corporation selects a valuation methodology (e.g.,
market comparables) for each investment and, in certain
instances, multiple inputs are weighted to derive the most
representative value. Discounts are applied as appropriate to
consider the lack of liquidity and marketability versus publicly-
traded companies. For private equity funds, fair value is determined
using the net asset value as provided by the individual fund’s
general partner.
The Corporation uses multiple market approaches in valuing
certain of its Level 3 financial instruments. For example, market
comparables and discounted cash flows are used together. For a
given product, such as corporate debt securities, market
comparables may be used to estimate some of the unobservable
inputs and then these inputs are incorporated into a discounted
cash flow model. Therefore, the balances disclosed encompass
both of these techniques.
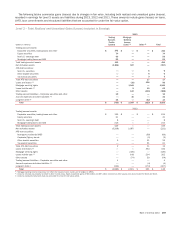
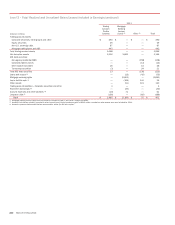
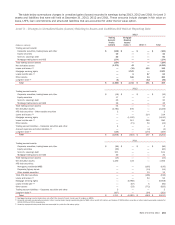
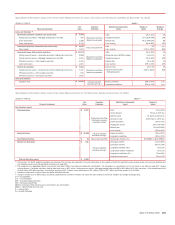
The level of aggregation and diversity within the products
disclosed in the tables result in certain ranges of inputs being
wide and unevenly distributed across asset and liability categories.
At December 31, 2013, weighted averages are disclosed for all
loans, securities, structured liabilities and net derivative assets.
At December 31, 2012, weighted averages were disclosed for all
loans and securities.
For credit derivatives, the range of credit spreads represented
positions with varying levels of default risk to the underlying
instruments. The lower end of the credit spread range typically
represented shorter-dated instruments and those with better
perceived credit risk. The higher end of the range represented
longer-dated instruments and those referencing debt issuances
that were more likely to be impaired or nonperforming. At
December 31, 2012, the majority of inputs were concentrated in
the lower end of the range. Similarly, the spread to index could
vary significantly based on the risk of the instrument. The spread
will be positive for instruments that have a higher risk of default
than the index (which is based on a weighted average of its
components) and negative for instruments that have a lower risk
of default than the index. At December 31, 2012, inputs were
distributed evenly throughout the range for spread to index. In
addition, for yield and credit correlation, the majority of the inputs
were concentrated in the center of the range. Inputs were
concentrated in the middle to lower end of the range for upfront
points. The range for loss severity reflected exposures that were
concentrated in the middle to upper end of the range while the
ranges for prepayment speed and default rates reflected
exposures that were concentrated in the lower end of the range.
For equity derivatives at December 31, 2012, including those
embedded in long-term debt, the range for equity correlation
represented exposure primarily concentrated toward the upper end
of the range. The range for long-dated volatilities represented
exposure primarily concentrated toward the lower end of the range.
For interest rate derivatives, the diversity in the portfolio was
reflected in wide ranges of inputs because the variety of currencies
and tenors of the transactions required the use of numerous
foreign exchange and interest rate curves. Since foreign exchange
and interest rate correlations were measured between curves and
across the various tenors on the same curve, the range of potential
values could include both negative and positive values. For the
correlation (IR/IR) range, the exposure represented the valuation
of interest rate correlations on less liquid pairings and was
concentrated at the upper end of the range at December 31, 2012.
For the correlation (FX/IR) range, the exposure was the sensitivity
to a broad mix of interest rate and foreign exchange correlations
and was distributed evenly throughout the range at December 31,
2012. For long-dated inflation rates and volatilities as well as long-
dated volatilities (FX), the inputs were concentrated in the middle
of the range.
For more information on the inputs and techniques used in the
valuation of MSRs, see Note 23 – Mortgage Servicing Rights.