Bank of America 2013 Annual Report Download - page 92
Download and view the complete annual report
Please find page 92 of the 2013 Bank of America annual report below. You can navigate through the pages in the report by either clicking on the pages listed below, or by using the keyword search tool below to find specific information within the annual report.-
 1
1 -
2
-
3
-
4
-
5
-
6
-
7
-
8
-
9
-
10
-
11
-
12
-
13
-
14
-
15
-
16
-
17
-
18
-
19
-
20
-
21
-
22
-
23
-
24
-
25
-
26
-
27
-
28
-
29
-
30
-
31
-
32
-
33
-
34
-
35
-
36
-
37
-
38
-
39
-
40
-
41
-
42
-
43
-
44
-
45
-
46
-
47
-
48
-
49
-
50
-
51
-
52
-
53
-
54
-
55
-
56
-
57
-
58
-
59
-
60
-
61
-
62
-
63
-
64
-
65
-
66
-
67
-
68
-
69
-
70
-
71
-
72
-
73
-
74
-
75
-
76
-
77
-
78
-
79
-
80
-
81
-
 82
82 -
 83
83 -
 84
84 -
 85
85 -
 86
86 -
 87
87 -
 88
88 -
 89
89 -
 90
90 -
 91
91 -
 92
92 -
 93
93 -
 94
94 -
 95
95 -
 96
96 -
 97
97 -
 98
98 -
 99
99 -
 100
100 -
 101
101 -
 102
102 -
103
-
104
-
105
-
106
-
107
-
108
-
109
-
110
-
111
-
112
-
113
-
114
-
115
-
116
-
117
-
118
-
119
-
120
-
121
-
122
-
123
-
124
-
125
-
126
-
127
-
128
-
129
-
130
-
131
-
132
-
133
-
134
-
135
-
136
-
137
-
138
-
139
-
140
-
141
-
142
-
143
-
144
-
145
-
146
-
147
-
148
-
149
-
150
-
151
-
152
-
153
-
154
-
155
-
156
-
157
-
158
-
159
-
160
-
161
-
162
-
163
-
164
-
165
-
166
-
167
-
168
-
169
-
170
-
171
-
172
-
173
-
174
-
175
-
176
-
177
-
178
-
179
-
180
-
181
-
182
-
183
-
184
-
185
-
186
-
187
-
188
-
189
-
190
-
191
-
192
-
193
-
194
-
195
-
196
-
197
-
198
-
199
-
200
-
201
-
202
-
203
-
204
-
205
-
206
-
207
-
208
-
209
-
210
-
211
-
212
-
213
-
214
-
215
-
216
-
217
-
218
-
219
-
220
-
221
-
222
-
223
-
224
-
225
-
226
-
227
-
228
-
229
-
230
-
231
-
232
-
233
-
234
-
235
-
236
-
237
-
238
-
239
-
240
-
241
-
242
-
243
-
244
-
245
-
246
-
247
-
248
-
249
-
250
-
251
-
252
-
253
-
254
-
255
-
256
-
257
-
258
-
259
-
260
-
261
-
262
-
263
-
264
-
265
-
266
-
267
-
268
-
269
-
270
-
271
-
272
-
273
-
274
-
275
-
276
-
277
-
278
-
279
-
280
-
281
-
282
-
283
-
284
 |
 |

90 Bank of America 2013
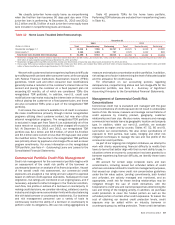
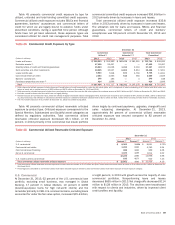
Commercial Real Estate
Commercial real estate primarily includes commercial loans and
leases secured by non-owner-occupied real estate and is
dependent on the sale or lease of the real estate as the primary
source of repayment. The portfolio remains diversified across
property types and geographic regions. California represented the
largest state concentration at 22 percent and 23 percent of
commercial real estate loans and leases at December 31, 2013
and 2012. The commercial real estate portfolio is predominantly
managed in Global Banking and consists of loans made primarily
to public and private developers, and commercial real estate firms.
Outstanding loans increased $9.3 billion, or 24 percent, in 2013
primarily due to new originations in major metropolitan markets.
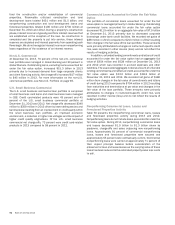
During 2013, we continued to see improvements in credit
quality in both the residential and non-residential portfolios. We
use a number of proactive risk mitigation initiatives to reduce
adversely rated exposure in the commercial real estate portfolio
including transfers of deteriorating exposures to management by
independent special asset officers and the pursuit of loan
restructurings or asset sales to achieve the best results for our
customers and the Corporation.
Nonperforming commercial real estate loans and foreclosed
properties decreased $1.4 billion, or 77 percent, and reservable
criticized balances decreased $2.3 billion, or 62 percent, in 2013.
Net charge-offs declined $235 million to $149 million in 2013.
These improvements were primarily in the non-residential portfolio.
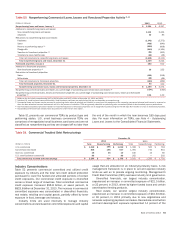
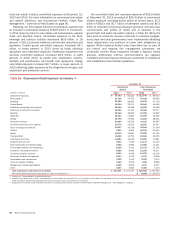
Table 47 presents outstanding commercial real estate loans
by geographic region, based on the geographic location of the
collateral, and by property type.
Table 47 Outstanding Commercial Real Estate Loans
December 31
(Dollars in millions) 2013 2012
By Geographic Region
California $10,358 $ 8,792
Northeast 9,487 7,315
Southwest 6,913 4,612
Southeast 5,314 4,440
Midwest 3,109 3,421
Florida 3,030 2,148
Illinois 2,319 1,700
Northwest 2,037 1,553
Midsouth 2,013 1,980
Non-U.S. 1,582 1,483
Other (1) 1,731 1,193
Total outstanding commercial real estate loans $ 47,893 $ 38,637
By Property Type
Non-residential
Office $12,799 $ 9,324
Multi-family rental 8,559 5,893
Shopping centers/retail 7,470 5,780
Industrial/warehouse 4,522 3,839
Hotels/motels 3,926 3,095
Multi-use 1,960 2,186
Land and land development 855 1,157
Other 6,283 5,722
Total non-residential 46,374 36,996
Residential 1,519 1,641
Total outstanding commercial real estate loans $ 47,893 $ 38,637
(1) Includes unsecured loans to real estate investment trusts and national home builders whose portfolios of properties span multiple geographic regions and properties in the states of Colorado, Utah,
Hawaii, Wyoming and Montana.