Bank of America 2013 Annual Report Download - page 38
Download and view the complete annual report
Please find page 38 of the 2013 Bank of America annual report below. You can navigate through the pages in the report by either clicking on the pages listed below, or by using the keyword search tool below to find specific information within the annual report.-
 1
1 -
2
-
3
-
4
-
5
-
6
-
7
-
8
-
9
-
10
-
11
-
12
-
13
-
14
-
15
-
16
-
17
-
18
-
19
-
20
-
21
-
22
-
23
-
24
-
25
-
26
-
27
-
 28
28 -
 29
29 -
 30
30 -
 31
31 -
 32
32 -
 33
33 -
 34
34 -
 35
35 -
 36
36 -
 37
37 -
 38
38 -
 39
39 -
 40
40 -
 41
41 -
 42
42 -
 43
43 -
 44
44 -
 45
45 -
 46
46 -
 47
47 -
 48
48 -
49
-
50
-
51
-
52
-
53
-
54
-
55
-
56
-
57
-
58
-
59
-
60
-
61
-
62
-
63
-
64
-
65
-
66
-
67
-
68
-
69
-
70
-
71
-
72
-
73
-
74
-
75
-
76
-
77
-
78
-
79
-
80
-
81
-
82
-
83
-
84
-
85
-
86
-
87
-
88
-
89
-
90
-
91
-
92
-
93
-
94
-
95
-
96
-
97
-
98
-
99
-
100
-
101
-
102
-
103
-
104
-
105
-
106
-
107
-
108
-
109
-
110
-
111
-
112
-
113
-
114
-
115
-
116
-
117
-
118
-
119
-
120
-
121
-
122
-
123
-
124
-
125
-
126
-
127
-
128
-
129
-
130
-
131
-
132
-
133
-
134
-
135
-
136
-
137
-
138
-
139
-
140
-
141
-
142
-
143
-
144
-
145
-
146
-
147
-
148
-
149
-
150
-
151
-
152
-
153
-
154
-
155
-
156
-
157
-
158
-
159
-
160
-
161
-
162
-
163
-
164
-
165
-
166
-
167
-
168
-
169
-
170
-
171
-
172
-
173
-
174
-
175
-
176
-
177
-
178
-
179
-
180
-
181
-
182
-
183
-
184
-
185
-
186
-
187
-
188
-
189
-
190
-
191
-
192
-
193
-
194
-
195
-
196
-
197
-
198
-
199
-
200
-
201
-
202
-
203
-
204
-
205
-
206
-
207
-
208
-
209
-
210
-
211
-
212
-
213
-
214
-
215
-
216
-
217
-
218
-
219
-
220
-
221
-
222
-
223
-
224
-
225
-
226
-
227
-
228
-
229
-
230
-
231
-
232
-
233
-
234
-
235
-
236
-
237
-
238
-
239
-
240
-
241
-
242
-
243
-
244
-
245
-
246
-
247
-
248
-
249
-
250
-
251
-
252
-
253
-
254
-
255
-
256
-
257
-
258
-
259
-
260
-
261
-
262
-
263
-
264
-
265
-
266
-
267
-
268
-
269
-
270
-
271
-
272
-
273
-
274
-
275
-
276
-
277
-
278
-
279
-
280
-
281
-
282
-
283
-
284
 |
 |

36 Bank of America 2013
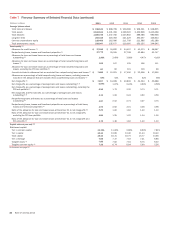
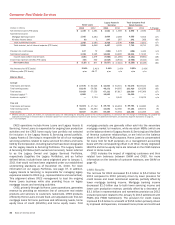
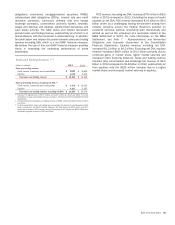
Consumer Real Estate Services
Home Loans
Legacy Assets &
Servicing
Total Consumer Real
Estate Services
(Dollars in millions) 2013 2012 2013 2012 2013 2012 % Change
Net interest income (FTE basis) $ 1,349 $ 1,361 $ 1,541 $ 1,569 $ 2,890 $ 2,930 (1)%
Noninterest income:
Mortgage banking income 1,916 3,284 2,669 2,269 4,585 5,553 (17)
All other income (loss) (6) 1247 267 241 268 (10)
Total noninterest income 1,910 3,285 2,916 2,536 4,826 5,821 (17)
Total revenue, net of interest expense (FTE basis) 3,259 4,646 4,457 4,105 7,716 8,751 (12)
Provision for credit losses 127 72 (283) 1,370 (156)1,442 n/m
Noninterest expense 3,318 3,195 12,695 13,995 16,013 17,190 (7)
Income (loss) before income taxes (186) 1,379 (7,955)(11,260) (8,141)(9,881) (18)
Income tax expense (benefit) (FTE basis) (68) 502 (2,918)(3,944) (2,986)(3,442) (13)
Net income (loss) $ (118) $ 877 $(5,037)$ (7,316) $(5,155)$ (6,439) (20)
Net interest yield (FTE basis) 2.54% 2.41% 3.19%2.45% 2.85%2.43%
Efficiency ratio (FTE basis) n/m 68.77 n/m n/m n/m n/m
Balance Sheet
Average
Total loans and leases $ 47,675 $ 50,023 $ 42,603 $ 53,501 $90,278 $103,524 (13)
Total earning assets 53,148 56,581 48,272 64,055 101,420 120,636 (16)
Total assets 53,429 57,552 67,131 87,817 120,560 145,369 (17)
Allocated capital (1) 6,000 —18,000 —24,000 — n/m
Economic capital (1) —3,734 —9,942 —13,676 n/m
Year end
Total loans and leases $ 51,021 $ 47,742 $ 38,732 $ 46,918 $89,753 $ 94,660 (5)
Total earning assets 54,071 54,394 43,092 52,580 97,163 106,974 (9)
Total assets 53,927 55,465 59,459 75,594 113,386 131,059 (13)
(1) Effective January 1, 2013, we revised, on a prospective basis, the methodology for allocating capital to the business segments. In connection with the change in methodology, we updated the
applicable terminology in the above table to allocated capital from economic capital as reported in prior periods. For additional information, see Business Segment Operations on page 31.
n/m = not meaningful
CRES operations include Home Loans and Legacy Assets &
Servicing. Home Loans is responsible for ongoing loan production
activities and the CRES home equity loan portfolio not selected
for inclusion in the Legacy Assets & Servicing owned portfolio.
Legacy Assets & Servicing is responsible for all of our mortgage
servicing activities related to loans serviced for others and loans
held by the Corporation, including loans that have been designated
as the Legacy Assets & Servicing Portfolios. The Legacy Assets
& Servicing Portfolios (both owned and serviced), herein referred
to as the Legacy Owned and Legacy Serviced Portfolios,
respectively (together, the Legacy Portfolios), and as further
defined below, include those loans originated prior to January 1,
2011 that would not have been originated under our established
underwriting standards as of December 31, 2010. For more
information on our Legacy Portfolios, see page 37. In addition,
Legacy Assets & Servicing is responsible for managing legacy
exposures related to CRES (e.g., representations and warranties).
This alignment allows CRES management to lead the ongoing
Home Loans business while also providing focus on legacy
mortgage issues and servicing activities.
CRES, primarily through its Home Loans operations, generates
revenue by providing an extensive line of consumer real estate
products and services to customers nationwide. CRES products
offered by Home Loans include fixed- and adjustable-rate first-lien
mortgage loans for home purchase and refinancing needs, home
equity lines of credit (HELOCs) and home equity loans. First
mortgage products are generally either sold into the secondary
mortgage market to investors, while we retain MSRs (which are
on the balance sheet of Legacy Assets & Servicing) and the Bank
of America customer relationships, or are held on the balance
sheet in All Other for ALM purposes. Home Loans is compensated
for loans held for ALM purposes on a management accounting
basis with the corresponding offset in All Other. Newly originated
HELOCs and home equity loans are retained on the CRES balance
sheet in Home Loans.
CRES includes the impact of migrating customers and their
related loan balances between GWIM and CRES. For more
information on the transfer of customer balances, see GWIM on
page 40.
CRES Results
The net loss for CRES decreased $1.3 billion to $5.2 billion for
2013 compared to 2012 primarily driven by lower provision for
credit losses and lower noninterest expense, partially offset by
lower mortgage banking income. Mortgage banking income
decreased $1.0 billion due to both lower servicing income and
lower core production revenue, partially offset by a decrease of
$3.1 billion in representations and warranties provision as 2012
included provision related to the January 6, 2013 settlement with
FNMA (the FNMA Settlement). The provision for credit losses
improved $1.6 billion to a benefit of $156 million primarily driven
by improved delinquencies, increased home prices and continued