Bank of America 2013 Annual Report Download - page 174
Download and view the complete annual report
Please find page 174 of the 2013 Bank of America annual report below. You can navigate through the pages in the report by either clicking on the pages listed below, or by using the keyword search tool below to find specific information within the annual report.-
 1
1 -
2
-
3
-
4
-
5
-
6
-
7
-
8
-
9
-
10
-
11
-
12
-
13
-
14
-
15
-
16
-
17
-
18
-
19
-
20
-
21
-
22
-
23
-
24
-
25
-
26
-
27
-
28
-
29
-
30
-
31
-
32
-
33
-
34
-
35
-
36
-
37
-
38
-
39
-
40
-
41
-
42
-
43
-
44
-
45
-
46
-
47
-
48
-
49
-
50
-
51
-
52
-
53
-
54
-
55
-
56
-
57
-
58
-
59
-
60
-
61
-
62
-
63
-
64
-
65
-
66
-
67
-
68
-
69
-
70
-
71
-
72
-
73
-
74
-
75
-
76
-
77
-
78
-
79
-
80
-
81
-
82
-
83
-
84
-
85
-
86
-
87
-
88
-
89
-
90
-
91
-
92
-
93
-
94
-
95
-
96
-
97
-
98
-
99
-
100
-
101
-
102
-
103
-
104
-
105
-
106
-
107
-
108
-
109
-
110
-
111
-
112
-
113
-
114
-
115
-
116
-
117
-
118
-
119
-
120
-
121
-
122
-
123
-
124
-
125
-
126
-
127
-
128
-
129
-
130
-
131
-
132
-
133
-
134
-
135
-
136
-
137
-
138
-
139
-
140
-
141
-
142
-
143
-
144
-
145
-
146
-
147
-
148
-
149
-
150
-
151
-
152
-
153
-
154
-
155
-
156
-
157
-
158
-
159
-
160
-
161
-
162
-
163
-
 164
164 -
 165
165 -
 166
166 -
 167
167 -
 168
168 -
 169
169 -
 170
170 -
 171
171 -
 172
172 -
 173
173 -
 174
174 -
 175
175 -
 176
176 -
 177
177 -
 178
178 -
 179
179 -
 180
180 -
 181
181 -
 182
182 -
 183
183 -
 184
184 -
185
-
186
-
187
-
188
-
189
-
190
-
191
-
192
-
193
-
194
-
195
-
196
-
197
-
198
-
199
-
200
-
201
-
202
-
203
-
204
-
205
-
206
-
207
-
208
-
209
-
210
-
211
-
212
-
213
-
214
-
215
-
216
-
217
-
218
-
219
-
220
-
221
-
222
-
223
-
224
-
225
-
226
-
227
-
228
-
229
-
230
-
231
-
232
-
233
-
234
-
235
-
236
-
237
-
238
-
239
-
240
-
241
-
242
-
243
-
244
-
245
-
246
-
247
-
248
-
249
-
250
-
251
-
252
-
253
-
254
-
255
-
256
-
257
-
258
-
259
-
260
-
261
-
262
-
263
-
264
-
265
-
266
-
267
-
268
-
269
-
270
-
271
-
272
-
273
-
274
-
275
-
276
-
277
-
278
-
279
-
280
-
281
-
282
-
283
-
284
 |
 |

172 Bank of America 2013
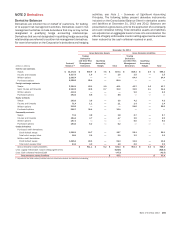
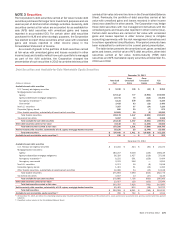
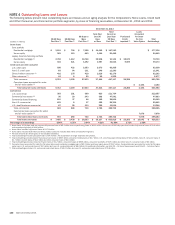
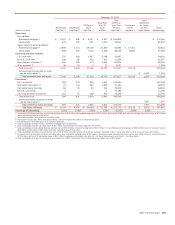
Credit derivative instruments where the Corporation is the
seller of credit protection and their expiration are summarized at
December 31, 2013 and 2012 in the table below. These
instruments are classified as investment and non-investment
grade based on the credit quality of the underlying referenced
obligation. The Corporation considers ratings of BBB- or higher as
investment grade. Non-investment grade includes non-rated credit
derivative instruments. The Corporation discloses internal
categorizations of investment grade and non-investment grade
consistent with how risk is managed for these instruments.
Credit Derivative Instruments
December 31, 2013
Carrying Value
(Dollars in millions)
Less than
One Year
One to
Three Years
Three to
Five Years
Over Five
Years Total
Credit default swaps:
Investment grade $2$
220 $974 $ 1,134 $ 2,330
Non-investment grade 424 1,924 2,469 6,667 11,484
Total 426 2,144 3,443 7,801 13,814
Total return swaps/other:
Investment grade 22 — ——
22
Non-investment grade 29 38 2 86 155
Total 51 38 2 86 177
Total credit derivatives $ 477 $ 2,182 $ 3,445 $ 7,887 $ 13,991
Credit-related notes: (1)
Investment grade $—$
278 $595 $ 4,457 $ 5,330
Non-investment grade 145 107 756 946 1,954
Total credit-related notes $ 145 $385 $ 1,351 $ 5,403 $ 7,284
Maximum Payout/Notional
Credit default swaps:
Investment grade $ 170,764 $ 379,273 $ 411,426 $ 36,039 $ 997,502
Non-investment grade 53,316 90,986 95,319 28,257 267,878
Total 224,080 470,259 506,745 64,296 1,265,380
Total return swaps/other:
Investment grade 21,771 — ——
21,771
Non-investment grade 27,784 8,150 4,103 1,599 41,636
Total 49,555 8,150 4,103 1,599 63,407
Total credit derivatives $ 273,635 $ 478,409 $ 510,848 $ 65,895 $ 1,328,787
December 31, 2012
Carrying Value
Credit default swaps:
Investment grade $ 52 $ 757 $ 5,595 $ 2,903 $ 9,307
Non-investment grade 923 4,403 7,030 10,959 23,315
Total 975 5,160 12,625 13,862 32,622
Total return swaps/other:
Investment grade 39 — — — 39
Non-investment grade 57 104 39 37 237
Total 96 104 39 37 276
Total credit derivatives $ 1,071 $ 5,264 $ 12,664 $ 13,899 $ 32,898
Credit-related notes: (1)
Investment grade $ 4 $ 12 $ 441 $ 3,849 $ 4,306
Non-investment grade 116 161 314 1,425 2,016
Total credit-related notes $ 120 $ 173 $ 755 $ 5,274 $ 6,322
Maximum Payout/Notional
Credit default swaps:
Investment grade $260,177 $349,125 $500,038 $ 90,453 $ 1,199,793
Non-investment grade 79,861 99,043 110,248 42,559 331,711
Total 340,038 448,168 610,286 133,012 1,531,504
Total return swaps/other:
Investment grade 43,536 15 — — 43,551
Non-investment grade 5,566 11,028 7,631 1,035 25,260
Total 49,102 11,043 7,631 1,035 68,811
Total credit derivatives $389,140 $459,211 $617,917 $134,047 $ 1,600,315
(1) For credit-related notes, maximum payout/notional is the same as carrying value.