Bank of America 2013 Annual Report Download - page 78
Download and view the complete annual report
Please find page 78 of the 2013 Bank of America annual report below. You can navigate through the pages in the report by either clicking on the pages listed below, or by using the keyword search tool below to find specific information within the annual report.-
 1
1 -
2
-
3
-
4
-
5
-
6
-
7
-
8
-
9
-
10
-
11
-
12
-
13
-
14
-
15
-
16
-
17
-
18
-
19
-
20
-
21
-
22
-
23
-
24
-
25
-
26
-
27
-
28
-
29
-
30
-
31
-
32
-
33
-
34
-
35
-
36
-
37
-
38
-
39
-
40
-
41
-
42
-
43
-
44
-
45
-
46
-
47
-
48
-
49
-
50
-
51
-
52
-
53
-
54
-
55
-
56
-
57
-
58
-
59
-
60
-
61
-
62
-
63
-
64
-
65
-
66
-
67
-
 68
68 -
 69
69 -
 70
70 -
 71
71 -
 72
72 -
 73
73 -
 74
74 -
 75
75 -
 76
76 -
 77
77 -
 78
78 -
 79
79 -
 80
80 -
 81
81 -
 82
82 -
 83
83 -
 84
84 -
 85
85 -
 86
86 -
 87
87 -
 88
88 -
89
-
90
-
91
-
92
-
93
-
94
-
95
-
96
-
97
-
98
-
99
-
100
-
101
-
102
-
103
-
104
-
105
-
106
-
107
-
108
-
109
-
110
-
111
-
112
-
113
-
114
-
115
-
116
-
117
-
118
-
119
-
120
-
121
-
122
-
123
-
124
-
125
-
126
-
127
-
128
-
129
-
130
-
131
-
132
-
133
-
134
-
135
-
136
-
137
-
138
-
139
-
140
-
141
-
142
-
143
-
144
-
145
-
146
-
147
-
148
-
149
-
150
-
151
-
152
-
153
-
154
-
155
-
156
-
157
-
158
-
159
-
160
-
161
-
162
-
163
-
164
-
165
-
166
-
167
-
168
-
169
-
170
-
171
-
172
-
173
-
174
-
175
-
176
-
177
-
178
-
179
-
180
-
181
-
182
-
183
-
184
-
185
-
186
-
187
-
188
-
189
-
190
-
191
-
192
-
193
-
194
-
195
-
196
-
197
-
198
-
199
-
200
-
201
-
202
-
203
-
204
-
205
-
206
-
207
-
208
-
209
-
210
-
211
-
212
-
213
-
214
-
215
-
216
-
217
-
218
-
219
-
220
-
221
-
222
-
223
-
224
-
225
-
226
-
227
-
228
-
229
-
230
-
231
-
232
-
233
-
234
-
235
-
236
-
237
-
238
-
239
-
240
-
241
-
242
-
243
-
244
-
245
-
246
-
247
-
248
-
249
-
250
-
251
-
252
-
253
-
254
-
255
-
256
-
257
-
258
-
259
-
260
-
261
-
262
-
263
-
264
-
265
-
266
-
267
-
268
-
269
-
270
-
271
-
272
-
273
-
274
-
275
-
276
-
277
-
278
-
279
-
280
-
281
-
282
-
283
-
284
 |
 |

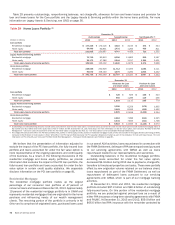
76 Bank of America 2013
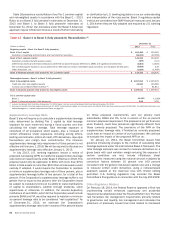
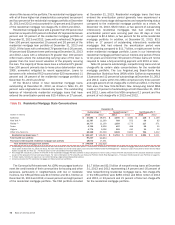
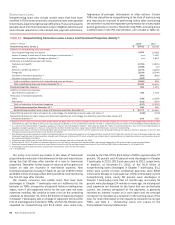
Table 29 presents outstandings, nonperforming balances, net charge-offs, allowance for loan and lease losses and provision for
loan and lease losses for the Core portfolio and the Legacy Assets & Servicing portfolio within the home loans portfolio. For more
information on Legacy Assets & Servicing, see CRES on page 36.
Table 29 Home Loans Portfolio (1)
December 31
Outstandings Nonperforming Net Charge-offs (2)
(Dollars in millions) 2013 2012 2013 2012 2013 2012
Core portfolio
Residential mortgage $ 177,336 $170,116 $ 3,316 $ 3,193 $274 $ 544
Home equity 54,499 60,851 1,431 1,265 439 811
Total Core portfolio 231,835 230,967 4,747 4,458 713 1,355
Legacy Assets & Servicing portfolio
Residential mortgage 70,730 82,813 8,396 11,862 810 2,567
Home equity 39,173 47,289 2,644 3,017 1,364 3,431
Total Legacy Assets & Servicing portfolio 109,903 130,102 11,040 14,879 2,174 5,998
Home loans portfolio
Residential mortgage 248,066 252,929 11,712 15,055 1,084 3,111
Home equity 93,672 108,140 4,075 4,282 1,803 4,242
Total home loans portfolio $ 341,738 $361,069 $ 15,787 $ 19,337 $ 2,887 $ 7,353
December 31
Allowance for Loan
and Lease Losses
Provision for Loan
and Lease Losses
2013 2012 2013 2012
Core portfolio
Residential mortgage $728 $ 829 $166 $ 523
Home equity 965 1,286 119 256
Total Core portfolio 1,693 2,115 285 779
Legacy Assets & Servicing portfolio
Residential mortgage 3,356 6,259 (979)1,802
Home equity 3,469 6,559 (430)1,492
Total Legacy Assets & Servicing portfolio 6,825 12,818 (1,409)3,294
Home loans portfolio
Residential mortgage 4,084 7,088 (813)2,325
Home equity 4,434 7,845 (311)1,748
Total home loans portfolio $ 8,518 $ 14,933 $(1,124)$ 4,073
(1) Outstandings and nonperforming amounts exclude loans accounted for under the fair value option. Consumer loans accounted for under the fair value option include residential mortgage loans of
$2.0 billion and $1.0 billion and home equity loans of $147 million and $0 at December 31, 2013 and 2012. For more information on the fair value option, see Consumer Portfolio Credit Risk
Management – Consumer Loans Accounted for Under the Fair Value Option on page 85 and Note 21 – Fair Value Option to the Consolidated Financial Statements.
(2) Net charge-offs exclude write-offs in the PCI loan portfolio of $1.2 billion in home equity and $1.1 billion in residential mortgage in 2013, which are included in the Legacy Assets & Servicing portfolio,
compared to $2.8 billion in home equity in 2012. Write-offs in the PCI loan portfolio decrease the PCI valuation allowance included as part of the allowance for loan and lease losses. For more
information on PCI write-offs, see Consumer Portfolio Credit Risk Management – Purchased Credit-impaired Loan Portfolio on page 81.
We believe that the presentation of information adjusted to
exclude the impact of the PCI loan portfolio, the fully-insured loan
portfolio and loans accounted for under the fair value option is
more representative of the ongoing operations and credit quality
of the business. As a result, in the following discussions of the
residential mortgage and home equity portfolios, we provide
information that excludes the impact of the PCI loan portfolio, the
fully-insured loan portfolio and loans accounted for under the fair
value option in certain credit quality statistics. We separately
disclose information on the PCI loan portfolio on page 81.
Residential Mortgage
The residential mortgage portfolio makes up the largest
percentage of our consumer loan portfolio at 47 percent of
consumer loans and leases at December 31, 2013. Approximately
19 percent of the residential mortgage portfolio is in GWIM and
represents residential mortgages that are originated for the home
purchase and refinancing needs of our wealth management
clients. The remaining portion of the portfolio is primarily in All
Other and is comprised of originated loans, purchased loans used
in our overall ALM activities, loans repurchased in connection with
the FNMA Settlement, delinquent FHA loans repurchased pursuant
to our servicing agreements with GNMA as well as loans
repurchased related to our representations and warranties.
Outstanding balances in the residential mortgage portfolio,
excluding loans accounted for under the fair value option,
decreased $4.9 billion during 2013 due to paydowns, charge-offs,
transfers to foreclosed properties and sales. These were partially
offset by new origination volume retained on our balance sheet,
loans repurchased as part of the FNMA Settlement, as well as
repurchases of delinquent loans pursuant to our servicing
agreements with GNMA, which is part of our mortgage banking
activities.
At December 31, 2013 and 2012, the residential mortgage
portfolio included $87.2 billion and $90.9 billion of outstanding
fully-insured loans. On this portion of the residential mortgage
portfolio, we are protected against principal loss as a result of
either FHA insurance or long-term stand-by agreements with FNMA
and FHLMC. At December 31, 2013 and 2012, $59.0 billion and
$66.6 billion had FHA insurance with the remainder protected by