Bank of America 2013 Annual Report Download - page 173
Download and view the complete annual report
Please find page 173 of the 2013 Bank of America annual report below. You can navigate through the pages in the report by either clicking on the pages listed below, or by using the keyword search tool below to find specific information within the annual report.-
 1
1 -
2
-
3
-
4
-
5
-
6
-
7
-
8
-
9
-
10
-
11
-
12
-
13
-
14
-
15
-
16
-
17
-
18
-
19
-
20
-
21
-
22
-
23
-
24
-
25
-
26
-
27
-
28
-
29
-
30
-
31
-
32
-
33
-
34
-
35
-
36
-
37
-
38
-
39
-
40
-
41
-
42
-
43
-
44
-
45
-
46
-
47
-
48
-
49
-
50
-
51
-
52
-
53
-
54
-
55
-
56
-
57
-
58
-
59
-
60
-
61
-
62
-
63
-
64
-
65
-
66
-
67
-
68
-
69
-
70
-
71
-
72
-
73
-
74
-
75
-
76
-
77
-
78
-
79
-
80
-
81
-
82
-
83
-
84
-
85
-
86
-
87
-
88
-
89
-
90
-
91
-
92
-
93
-
94
-
95
-
96
-
97
-
98
-
99
-
100
-
101
-
102
-
103
-
104
-
105
-
106
-
107
-
108
-
109
-
110
-
111
-
112
-
113
-
114
-
115
-
116
-
117
-
118
-
119
-
120
-
121
-
122
-
123
-
124
-
125
-
126
-
127
-
128
-
129
-
130
-
131
-
132
-
133
-
134
-
135
-
136
-
137
-
138
-
139
-
140
-
141
-
142
-
143
-
144
-
145
-
146
-
147
-
148
-
149
-
150
-
151
-
152
-
153
-
154
-
155
-
156
-
157
-
158
-
159
-
160
-
161
-
162
-
 163
163 -
 164
164 -
 165
165 -
 166
166 -
 167
167 -
 168
168 -
 169
169 -
 170
170 -
 171
171 -
 172
172 -
 173
173 -
 174
174 -
 175
175 -
 176
176 -
 177
177 -
 178
178 -
 179
179 -
 180
180 -
 181
181 -
 182
182 -
 183
183 -
184
-
185
-
186
-
187
-
188
-
189
-
190
-
191
-
192
-
193
-
194
-
195
-
196
-
197
-
198
-
199
-
200
-
201
-
202
-
203
-
204
-
205
-
206
-
207
-
208
-
209
-
210
-
211
-
212
-
213
-
214
-
215
-
216
-
217
-
218
-
219
-
220
-
221
-
222
-
223
-
224
-
225
-
226
-
227
-
228
-
229
-
230
-
231
-
232
-
233
-
234
-
235
-
236
-
237
-
238
-
239
-
240
-
241
-
242
-
243
-
244
-
245
-
246
-
247
-
248
-
249
-
250
-
251
-
252
-
253
-
254
-
255
-
256
-
257
-
258
-
259
-
260
-
261
-
262
-
263
-
264
-
265
-
266
-
267
-
268
-
269
-
270
-
271
-
272
-
273
-
274
-
275
-
276
-
277
-
278
-
279
-
280
-
281
-
282
-
283
-
284
 |
 |

Bank of America 2013 171
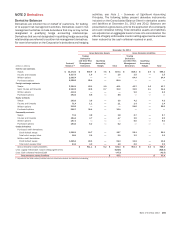
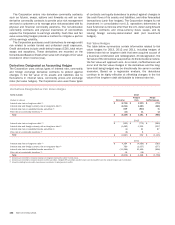
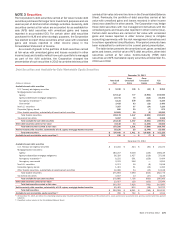
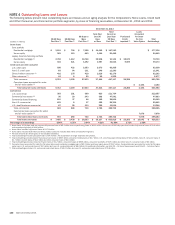
The table below, which includes both derivatives and non-
derivative cash instruments, identifies the amounts in the
respective income statement line items attributable to the
Corporation’s sales and trading revenue in Global Markets,
categorized by primary risk, for 2013, 2012 and 2011. The
difference between total trading account profits in the table below
and in the Consolidated Statement of Income represents trading
activities in business segments other than Global Markets. This
table includes debit valuation adjustment (DVA) gains (losses), net
of hedges. Global Markets results in Note 24 – Business Segment
Information are presented on a fully taxable-equivalent (FTE) basis.
The table below is not presented on a FTE basis.
Sales and Trading Revenue
2013
(Dollars in millions)
Trading
Account
Profits
Net
Interest
Income Other (1) Total
Interest rate risk $ 1,120 $ 1,104 $ 83 $ 2,307
Foreign exchange risk 1,170 4 (26) 1,148
Equity risk 1,994 112 2,094 4,200
Credit risk 2,075 2,711 88 4,874
Other risk 375 (203)202 374
Total sales and trading revenue $ 6,734 $ 3,728 $ 2,441 $ 12,903
2012
Interest rate risk $ 583 $ 1,040 $ (6) $ 1,617
Foreign exchange risk 909 5 6 920
Equity risk 1,180 (57) 1,891 3,014
Credit risk 2,522 2,321 961 5,804
Other risk 512 (219) (42) 251
Total sales and trading revenue $ 5,706 $ 3,090 $ 2,810 $ 11,606
2011
Interest rate risk $ 2,148 $ 923 $ (63) $ 3,008
Foreign exchange risk 1,090 8 (10) 1,088
Equity risk 1,482 129 2,347 3,958
Credit risk 1,067 2,605 552 4,224
Other risk 630 (184) (72) 374
Total sales and trading revenue $ 6,417 $ 3,481 $ 2,754 $ 12,652
(1) Represents amounts in investment and brokerage services and other income (loss) that are recorded in Global Markets and included in the definition of sales and trading revenue. Includes investment
and brokerage services revenue of $2.0 billion, $1.8 billion and $2.2 billion for 2013, 2012 and 2011, respectively.
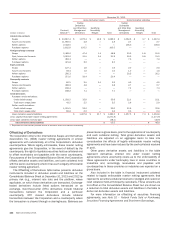
Credit Derivatives
The Corporation enters into credit derivatives primarily to facilitate
client transactions and to manage credit risk exposures. Credit
derivatives derive value based on an underlying third-party
referenced obligation or a portfolio of referenced obligations and
generally require the Corporation, as the seller of credit protection,
to make payments to a buyer upon the occurrence of a pre-defined
credit event. Such credit events generally include bankruptcy of
the referenced credit entity and failure to pay under the obligation,
as well as acceleration of indebtedness and payment repudiation
or moratorium. For credit derivatives based on a portfolio of
referenced credits or credit indices, the Corporation may not be
required to make payment until a specified amount of loss has
occurred and/or may only be required to make payment up to a
specified amount.