Bank of America 2013 Annual Report Download - page 34
Download and view the complete annual report
Please find page 34 of the 2013 Bank of America annual report below. You can navigate through the pages in the report by either clicking on the pages listed below, or by using the keyword search tool below to find specific information within the annual report.-
 1
1 -
2
-
3
-
4
-
5
-
6
-
7
-
8
-
9
-
10
-
11
-
12
-
13
-
14
-
15
-
16
-
17
-
18
-
19
-
20
-
21
-
22
-
23
-
 24
24 -
 25
25 -
 26
26 -
 27
27 -
 28
28 -
 29
29 -
 30
30 -
 31
31 -
 32
32 -
 33
33 -
 34
34 -
 35
35 -
 36
36 -
 37
37 -
 38
38 -
 39
39 -
 40
40 -
 41
41 -
 42
42 -
 43
43 -
 44
44 -
45
-
46
-
47
-
48
-
49
-
50
-
51
-
52
-
53
-
54
-
55
-
56
-
57
-
58
-
59
-
60
-
61
-
62
-
63
-
64
-
65
-
66
-
67
-
68
-
69
-
70
-
71
-
72
-
73
-
74
-
75
-
76
-
77
-
78
-
79
-
80
-
81
-
82
-
83
-
84
-
85
-
86
-
87
-
88
-
89
-
90
-
91
-
92
-
93
-
94
-
95
-
96
-
97
-
98
-
99
-
100
-
101
-
102
-
103
-
104
-
105
-
106
-
107
-
108
-
109
-
110
-
111
-
112
-
113
-
114
-
115
-
116
-
117
-
118
-
119
-
120
-
121
-
122
-
123
-
124
-
125
-
126
-
127
-
128
-
129
-
130
-
131
-
132
-
133
-
134
-
135
-
136
-
137
-
138
-
139
-
140
-
141
-
142
-
143
-
144
-
145
-
146
-
147
-
148
-
149
-
150
-
151
-
152
-
153
-
154
-
155
-
156
-
157
-
158
-
159
-
160
-
161
-
162
-
163
-
164
-
165
-
166
-
167
-
168
-
169
-
170
-
171
-
172
-
173
-
174
-
175
-
176
-
177
-
178
-
179
-
180
-
181
-
182
-
183
-
184
-
185
-
186
-
187
-
188
-
189
-
190
-
191
-
192
-
193
-
194
-
195
-
196
-
197
-
198
-
199
-
200
-
201
-
202
-
203
-
204
-
205
-
206
-
207
-
208
-
209
-
210
-
211
-
212
-
213
-
214
-
215
-
216
-
217
-
218
-
219
-
220
-
221
-
222
-
223
-
224
-
225
-
226
-
227
-
228
-
229
-
230
-
231
-
232
-
233
-
234
-
235
-
236
-
237
-
238
-
239
-
240
-
241
-
242
-
243
-
244
-
245
-
246
-
247
-
248
-
249
-
250
-
251
-
252
-
253
-
254
-
255
-
256
-
257
-
258
-
259
-
260
-
261
-
262
-
263
-
264
-
265
-
266
-
267
-
268
-
269
-
270
-
271
-
272
-
273
-
274
-
275
-
276
-
277
-
278
-
279
-
280
-
281
-
282
-
283
-
284
 |
 |

32 Bank of America 2013
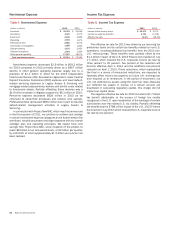
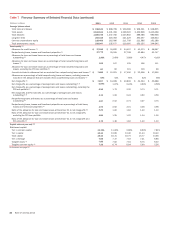
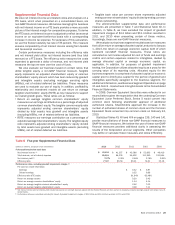
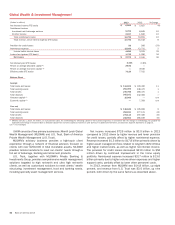
We prepare and evaluate segment results using certain non-GAAP financial measures. For additional information, see Supplemental
Financial Data on page 29. Table 10 provides selected summary financial data for our business segments and All Other for 2013
compared to 2012.
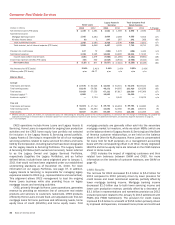
Table 10 Business Segment Results
Total Revenue (1)
Provision for Credit
Losses Noninterest Expense Net Income (Loss)
(Dollars in millions) 2013 2012 2013 2012 2013 2012 2013 2012
Consumer & Business Banking $ 29,867 $ 29,790 $ 3,107 $ 4,148 $ 16,357 $ 16,995 $ 6,588 $ 5,546
Consumer Real Estate Services 7,716 8,751 (156) 1,442 16,013 17,190 (5,155)(6,439)
Global Wealth & Investment Management 17,790 16,518 56 266 13,038 12,721 2,974 2,245
Global Banking 16,481 15,674 1,075 (342) 7,552 7,619 4,974 5,344
Global Markets 16,058 14,284 140 34 12,013 11,295 1,563 1,229
All Other 1,889 (782) (666) 2,621 4,241 6,273 487 (3,737)
Total FTE basis 89,801 84,235 3,556 8,169 69,214 72,093 11,431 4,188
FTE adjustment (859) (901) ——————
Total Consolidated $ 88,942 $ 83,334 $ 3,556 $ 8,169 $ 69,214 $ 72,093 $11,431 $ 4,188
(1) Total revenue is net of interest expense and is on a FTE basis which for consolidated revenue is a non-GAAP financial measure. For more information on this measure, see Supplemental Financial
Data on page 29, and for a corresponding reconciliation to a GAAP financial measure, see Statistical Table X V.
The management accounting and reporting process derives
segment and business results by utilizing allocation
methodologies for revenue and expense. The net income derived
for the businesses is dependent upon revenue and cost allocations
using an activity-based costing model, funds transfer pricing, and
other methodologies and assumptions management believes are
appropriate to reflect the results of the business.
Total revenue, net of interest expense, includes net interest
income on a FTE basis and noninterest income. The adjustment
of net interest income to a FTE basis results in a corresponding
increase in income tax expense. The segment results also reflect
certain revenue and expense methodologies that are utilized to
determine net income. The net interest income of the businesses
includes the results of a funds transfer pricing process that
matches assets and liabilities with similar interest rate sensitivity
and maturity characteristics. For presentation purposes, in
segments where the total of liabilities and equity exceeds assets,
which are generally deposit-taking segments, we allocate assets
to match liabilities. Net interest income of the business segments
also includes an allocation of net interest income generated by
certain of our ALM activities.
Our ALM activities include an overall interest rate risk
management strategy that incorporates the use of various
derivatives and cash instruments to manage fluctuations in
earnings and capital that are caused by interest rate volatility. Our
goal is to manage interest rate sensitivity so that movements in
interest rates do not significantly adversely affect earnings and
capital. The results of a majority of our ALM activities are allocated
to the business segments and fluctuate based on the performance
of the ALM activities. ALM activities include external product pricing
decisions including deposit pricing strategies, the effects of our
internal funds transfer pricing process and the net effects of other
ALM activities.
Certain expenses not directly attributable to a specific business
segment are allocated to the segments. The most significant of
these expenses include data and item processing costs and
certain centralized or shared functions. Data processing costs are
allocated to the segments based on equipment usage. Item
processing costs are allocated to the segments based on the
volume of items processed for each segment. The costs of certain
other centralized or shared functions are allocated based on
methodologies that reflect utilization.
Effective January 1, 2013, on a prospective basis, we adjusted
the amount of capital being allocated to our business segments.
The adjustment reflected a refinement to the prior-year
methodology (economic capital) which focused solely on internal
risk-based economic capital models. The refined methodology
(allocated capital) now also considers the effect of regulatory
capital requirements in addition to internal risk-based economic
capital models. The Corporation’s internal risk-based capital
models use a risk-adjusted methodology incorporating each
segment’s credit, market, interest rate, business and operational
risk components. For more information on the nature of these
risks, see Managing Risk on page 57 and Strategic Risk
Management on page 61. The capital allocated to the business
segments is currently referred to as allocated capital and, prior to
January 1, 2013, was referred to as economic capital, both of
which represent non-GAAP financial measures. For purposes of
goodwill impairment testing, the Corporation utilizes allocated
equity as a proxy for the carrying value of its reporting units. For
additional information, see Note 8 – Goodwill and Intangible Assets
to the Consolidated Financial Statements.
Allocated capital is subject to change over time, and as part of
our normal annual planning process, the capital being allocated
to our business segments is expected to change in the first quarter
of 2014. We expect that this change will result in a reduction of
unallocated tangible capital and an aggregate increase to the
amount of capital being allocated to the business segments.
For more information on the business segments and
reconciliations to consolidated total revenue, net income (loss)
and year-end total assets, see Note 24 – Business Segment
Information to the Consolidated Financial Statements.