Bank of America 2013 Annual Report Download - page 108
Download and view the complete annual report
Please find page 108 of the 2013 Bank of America annual report below. You can navigate through the pages in the report by either clicking on the pages listed below, or by using the keyword search tool below to find specific information within the annual report.-
 1
1 -
2
-
3
-
4
-
5
-
6
-
7
-
8
-
9
-
10
-
11
-
12
-
13
-
14
-
15
-
16
-
17
-
18
-
19
-
20
-
21
-
22
-
23
-
24
-
25
-
26
-
27
-
28
-
29
-
30
-
31
-
32
-
33
-
34
-
35
-
36
-
37
-
38
-
39
-
40
-
41
-
42
-
43
-
44
-
45
-
46
-
47
-
48
-
49
-
50
-
51
-
52
-
53
-
54
-
55
-
56
-
57
-
58
-
59
-
60
-
61
-
62
-
63
-
64
-
65
-
66
-
67
-
68
-
69
-
70
-
71
-
72
-
73
-
74
-
75
-
76
-
77
-
78
-
79
-
80
-
81
-
82
-
83
-
84
-
85
-
86
-
87
-
88
-
89
-
90
-
91
-
92
-
93
-
94
-
95
-
96
-
97
-
 98
98 -
 99
99 -
 100
100 -
 101
101 -
 102
102 -
 103
103 -
 104
104 -
 105
105 -
 106
106 -
 107
107 -
 108
108 -
 109
109 -
 110
110 -
 111
111 -
 112
112 -
 113
113 -
 114
114 -
 115
115 -
 116
116 -
 117
117 -
 118
118 -
119
-
120
-
121
-
122
-
123
-
124
-
125
-
126
-
127
-
128
-
129
-
130
-
131
-
132
-
133
-
134
-
135
-
136
-
137
-
138
-
139
-
140
-
141
-
142
-
143
-
144
-
145
-
146
-
147
-
148
-
149
-
150
-
151
-
152
-
153
-
154
-
155
-
156
-
157
-
158
-
159
-
160
-
161
-
162
-
163
-
164
-
165
-
166
-
167
-
168
-
169
-
170
-
171
-
172
-
173
-
174
-
175
-
176
-
177
-
178
-
179
-
180
-
181
-
182
-
183
-
184
-
185
-
186
-
187
-
188
-
189
-
190
-
191
-
192
-
193
-
194
-
195
-
196
-
197
-
198
-
199
-
200
-
201
-
202
-
203
-
204
-
205
-
206
-
207
-
208
-
209
-
210
-
211
-
212
-
213
-
214
-
215
-
216
-
217
-
218
-
219
-
220
-
221
-
222
-
223
-
224
-
225
-
226
-
227
-
228
-
229
-
230
-
231
-
232
-
233
-
234
-
235
-
236
-
237
-
238
-
239
-
240
-
241
-
242
-
243
-
244
-
245
-
246
-
247
-
248
-
249
-
250
-
251
-
252
-
253
-
254
-
255
-
256
-
257
-
258
-
259
-
260
-
261
-
262
-
263
-
264
-
265
-
266
-
267
-
268
-
269
-
270
-
271
-
272
-
273
-
274
-
275
-
276
-
277
-
278
-
279
-
280
-
281
-
282
-
283
-
284
 |
 |
106 Bank of America 2013
Global Markets Risk Management continually reviews,
evaluates and enhances our VaR model so that it reflects the
material risks in our trading portfolio. Changes to the VaR model
are reviewed and approved prior to implementation and any
material changes are reported to management through the
appropriate governance committees.
Market risk VaR for trading activities as presented in Table 66
differs from VaR used for regulatory capital calculations (regulatory
VaR). The VaR disclosed in Table 66 excludes both counterparty
CVA, which are adjustments to the mark-to-market value of our
derivative exposures to reflect the impact of the credit quality of
counterparties on our derivatives assets, and the corresponding
hedges. Regulatory standards require that regulatory VaR only
exclude counterparty CVA but include the corresponding hedges.
The holding period for regulatory VaR is 10 days while for the
market risk VaR presented below, it is one day. Both regulatory
and market risk VaR values utilize the same process and
methodology. For more information on certain components in
regulatory VaR, see Capital Management – Regulatory Capital
Changes on page 64.
The market risk across all business segments to which the
Corporation is exposed is included in the total market-based
trading portfolio VaR results. The majority of this portfolio is within
the Global Markets segment.
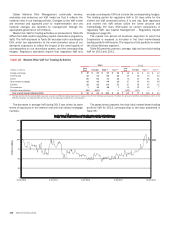
Table 66 presents year-end, average, high and low daily trading
VaR for 2013 and 2012.
Table 66 Market Risk VaR for Trading Activities
2013 2012
(Dollars in millions) Year
End Average High
(1) Low
(1) Year
End Average High
(1) Low
(1)
Foreign exchange $ 16 $ 20 $ 42 $ 12 $26$21$34$12
Interest rate 32 34 66 20 49 46 75 30
Credit 66 53 72 33 73 50 81 31
Real estate/mortgage 35 28 44 20 37 34 45 28
Equities 25 29 56 17 27 28 55 15
Commodities 71218 713 13 18 7
Portfolio diversification (82) (107) — — (103) (117) — —
Total market-based trading portfolio $ 99 $ 69 $ 115 $ 42 $ 122 $ 75 $ 128 $ 42
(1) The high and low for the total portfolio may have occurred on different trading days than the high and low for the individual components. Therefore the amount of portfolio diversification, which is the
difference between the total portfolio and the sum of the individual components, is not relevant.
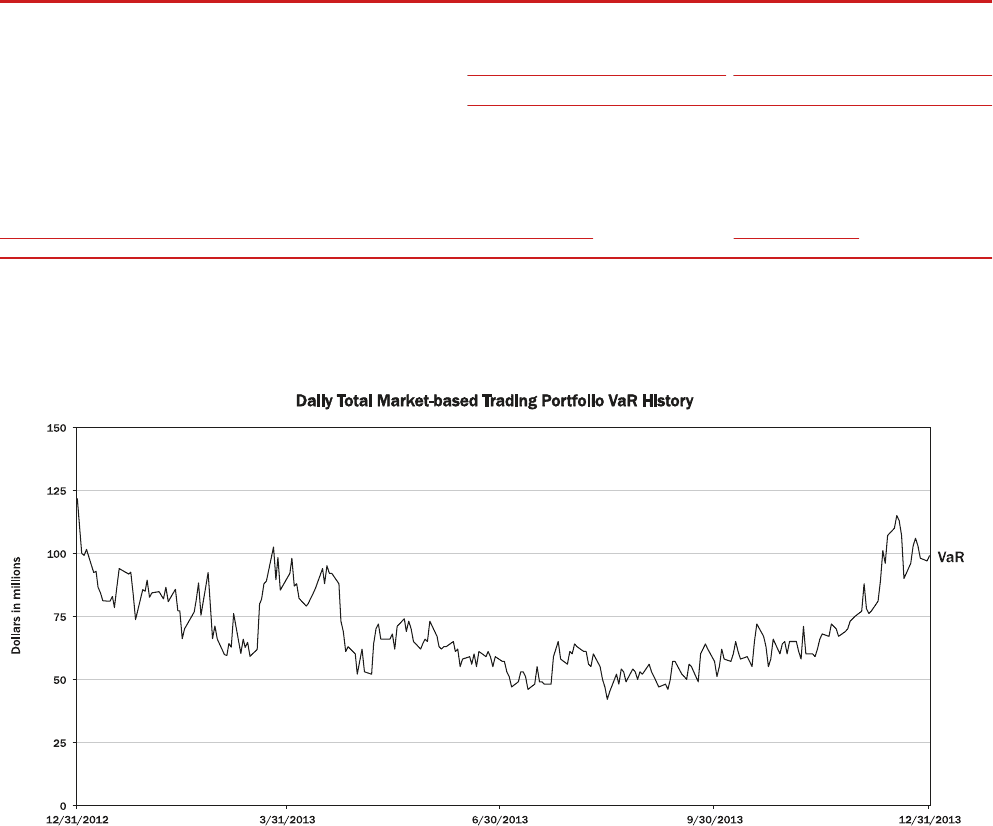
The decrease in average VaR during 2013 was driven by lower
levels of exposures in the interest rate and real estate/mortgage
markets.
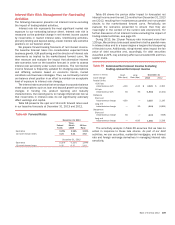
The graph below presents the daily total market-based trading
portfolio VaR for 2013, corresponding to the data presented in
Table 66.