Bank of America 2013 Annual Report Download - page 136
Download and view the complete annual report
Please find page 136 of the 2013 Bank of America annual report below. You can navigate through the pages in the report by either clicking on the pages listed below, or by using the keyword search tool below to find specific information within the annual report.-
 1
1 -
2
-
3
-
4
-
5
-
6
-
7
-
8
-
9
-
10
-
11
-
12
-
13
-
14
-
15
-
16
-
17
-
18
-
19
-
20
-
21
-
22
-
23
-
24
-
25
-
26
-
27
-
28
-
29
-
30
-
31
-
32
-
33
-
34
-
35
-
36
-
37
-
38
-
39
-
40
-
41
-
42
-
43
-
44
-
45
-
46
-
47
-
48
-
49
-
50
-
51
-
52
-
53
-
54
-
55
-
56
-
57
-
58
-
59
-
60
-
61
-
62
-
63
-
64
-
65
-
66
-
67
-
68
-
69
-
70
-
71
-
72
-
73
-
74
-
75
-
76
-
77
-
78
-
79
-
80
-
81
-
82
-
83
-
84
-
85
-
86
-
87
-
88
-
89
-
90
-
91
-
92
-
93
-
94
-
95
-
96
-
97
-
98
-
99
-
100
-
101
-
102
-
103
-
104
-
105
-
106
-
107
-
108
-
109
-
110
-
111
-
112
-
113
-
114
-
115
-
116
-
117
-
118
-
119
-
120
-
121
-
122
-
123
-
124
-
125
-
 126
126 -
 127
127 -
 128
128 -
 129
129 -
 130
130 -
 131
131 -
 132
132 -
 133
133 -
 134
134 -
 135
135 -
 136
136 -
 137
137 -
 138
138 -
 139
139 -
 140
140 -
 141
141 -
 142
142 -
 143
143 -
 144
144 -
 145
145 -
 146
146 -
147
-
148
-
149
-
150
-
151
-
152
-
153
-
154
-
155
-
156
-
157
-
158
-
159
-
160
-
161
-
162
-
163
-
164
-
165
-
166
-
167
-
168
-
169
-
170
-
171
-
172
-
173
-
174
-
175
-
176
-
177
-
178
-
179
-
180
-
181
-
182
-
183
-
184
-
185
-
186
-
187
-
188
-
189
-
190
-
191
-
192
-
193
-
194
-
195
-
196
-
197
-
198
-
199
-
200
-
201
-
202
-
203
-
204
-
205
-
206
-
207
-
208
-
209
-
210
-
211
-
212
-
213
-
214
-
215
-
216
-
217
-
218
-
219
-
220
-
221
-
222
-
223
-
224
-
225
-
226
-
227
-
228
-
229
-
230
-
231
-
232
-
233
-
234
-
235
-
236
-
237
-
238
-
239
-
240
-
241
-
242
-
243
-
244
-
245
-
246
-
247
-
248
-
249
-
250
-
251
-
252
-
253
-
254
-
255
-
256
-
257
-
258
-
259
-
260
-
261
-
262
-
263
-
264
-
265
-
266
-
267
-
268
-
269
-
270
-
271
-
272
-
273
-
274
-
275
-
276
-
277
-
278
-
279
-
280
-
281
-
282
-
283
-
284
 |
 |

134 Bank of America 2013
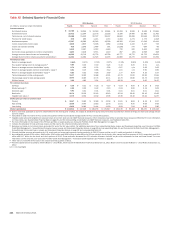
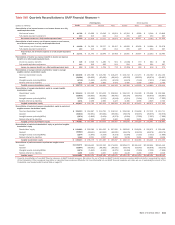
Table XII Selected Quarterly Financial Data
2013 Quarters 2012 Quarters
(In millions, except per share information) Fourth Third Second First Fourth Third Second First
Income statement
Net interest income $ 10,786 $ 10,266 $ 10,549 $ 10,664 $ 10,324 $ 9,938 $ 9,548 $ 10,846
Noninterest income 10,702 11,264 12,178 12,533 8,336 10,490 12,420 11,432
Total revenue, net of interest expense 21,488 21,530 22,727 23,197 18,660 20,428 21,968 22,278
Provision for credit losses 336 296 1,211 1,713 2,204 1,774 1,773 2,418
Noninterest expense 17,307 16,389 16,018 19,500 18,360 17,544 17,048 19,141
Income (loss) before income taxes 3,845 4,845 5,498 1,984 (1,904) 1,110 3,147 719
Income tax expense (benefit) 406 2,348 1,486 501 (2,636) 770 684 66
Net income 3,439 2,497 4,012 1,483 732 340 2,463 653
Net income (loss) applicable to common shareholders 3,183 2,218 3,571 1,110 367 (33) 2,098 328
Average common shares issued and outstanding 10,633 10,719 10,776 10,799 10,777 10,776 10,776 10,651
Average diluted common shares issued and outstanding (1) 11,404 11,482 11,525 11,155 10,885 10,776 11,556 10,762
Performance ratios
Return on average assets 0.64% 0.47% 0.74% 0.27% 0.13% 0.06% 0.45% 0.12%
Four quarter trailing return on average assets (2) 0.53 0.40 0.30 0.23 0.19 0.25 0.51 n/m
Return on average common shareholders’ equity 5.74 4.06 6.55 2.06 0.67 n/m 3.89 0.62
Return on average tangible common shareholders’ equity (3) 8.61 6.15 9.88 3.12 1.01 n/m 5.95 0.95
Return on average tangible shareholders’ equity (3) 8.53 6.32 9.98 3.69 1.77 0.84 6.16 1.67
Total ending equity to total ending assets 11.07 10.92 10.88 10.91 10.72 11.02 10.92 10.66
Total average equity to total average assets 10.93 10.85 10.76 10.71 10.79 10.86 10.73 10.63
Dividend payout 3.33 4.82 3.01 9.75 29.33 n/m 5.60 34.97
Per common share data
Earnings $0.30
$ 0.21 $ 0.33 $ 0.10 $ 0.03 $ 0.00 $ 0.19 $ 0.03
Diluted earnings (1) 0.29 0.20 0.32 0.10 0.03 0.00 0.19 0.03
Dividends paid 0.01 0.01 0.01 0.01 0.01 0.01 0.01 0.01
Book value 20.71 20.50 20.18 20.19 20.24 20.40 20.16 19.83
Tangible book value (3) 13.79 13.62 13.32 13.36 13.36 13.48 13.22 12.87
Market price per share of common stock
Closing $ 15.57 $ 13.80 $ 12.86 $ 12.18 $ 11.61 $ 8.83 $ 8.18 $ 9.57
High closing 15.88 14.95 13.83 12.78 11.61 9.55 9.68 9.93
Low closing 13.69 12.83 11.44 11.03 8.93 7.04 6.83 5.80
Market capitalization $ 164,914 $ 147,429 $ 138,156 $ 131,817 $ 125,136 $ 95,163 $ 88,155 $ 103,123
(1) Due to a net loss applicable to common shareholders for the third quarter of 2012, the impact of antidilutive equity instruments was excluded from diluted earnings per share and average diluted
common shares.
(2) Calculated as total net income for four consecutive quarters divided by annualized average assets for four consecutive quarters.
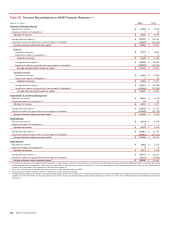
(3) Tangible equity ratios and tangible book value per share of common stock are non-GAAP financial measures. Other companies may define or calculate these measures differently. For more information
on these ratios, see Supplemental Financial Data on page 29, and for corresponding reconciliations to GAAP financial measures, see Statistical Table XVII.
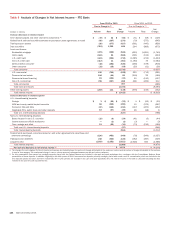
(4) For more information on the impact of the PCI loan portfolio on asset quality, see Consumer Portfolio Credit Risk Management on page 73.
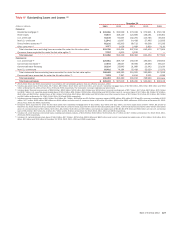
(5) Includes the allowance for loan and lease losses and the reserve for unfunded lending commitments.
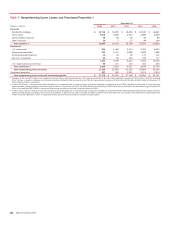
(6) Balances and ratios do not include loans accounted for under the fair value option. For additional exclusions from nonperforming loans, leases and foreclosed properties, see Consumer Portfolio
Credit Risk Management – Nonperforming Consumer Loans, Leases and Foreclosed Properties Activity on page 85 and corresponding Table 41, and Commercial Portfolio Credit Risk Management –
Nonperforming Commercial Loans, Leases and Foreclosed Properties Activity on page 92 and corresponding Table 50.
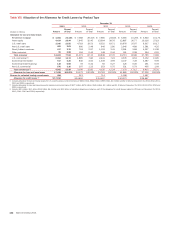
(7) Primarily includes amounts allocated to the U.S. credit card and unsecured consumer lending portfolios in CBB, PCI loans and the non-U.S. credit card portfolio in All Other.
(8) Net charge-offs exclude $741 million, $443 million, $313 million and $839 million of write-offs in the PCI loan portfolio for the fourth, third, second and first quarters of 2013, respectively, and $1.1
billion and $1.7 billion for the fourth and third quarters of 2012. These write-offs decreased the PCI valuation allowance included as part of the allowance for loan and lease losses. For more
information on PCI write-offs, see Consumer Portfolio Credit Risk Management – Purchased Credit-impaired Loan Portfolio on page 81.
(9) There were no write-offs of PCI loans in the second and first quarters of 2012.
(10) Presents capital ratios in accordance with the Basel 1 – 2013 Rules, which include the Market Risk Final Rule at December 31, 2013. Basel 1 did not include the Basel 1 – 2013 Rules at December 31,
2012.
n/m = not meaningful