Bank of America 2013 Annual Report Download - page 64
Download and view the complete annual report
Please find page 64 of the 2013 Bank of America annual report below. You can navigate through the pages in the report by either clicking on the pages listed below, or by using the keyword search tool below to find specific information within the annual report.-
 1
1 -
2
-
3
-
4
-
5
-
6
-
7
-
8
-
9
-
10
-
11
-
12
-
13
-
14
-
15
-
16
-
17
-
18
-
19
-
20
-
21
-
22
-
23
-
24
-
25
-
26
-
27
-
28
-
29
-
30
-
31
-
32
-
33
-
34
-
35
-
36
-
37
-
38
-
39
-
40
-
41
-
42
-
43
-
44
-
45
-
46
-
47
-
48
-
49
-
50
-
51
-
52
-
53
-
 54
54 -
 55
55 -
 56
56 -
 57
57 -
 58
58 -
 59
59 -
 60
60 -
 61
61 -
 62
62 -
 63
63 -
 64
64 -
 65
65 -
 66
66 -
 67
67 -
 68
68 -
 69
69 -
 70
70 -
 71
71 -
 72
72 -
 73
73 -
 74
74 -
75
-
76
-
77
-
78
-
79
-
80
-
81
-
82
-
83
-
84
-
85
-
86
-
87
-
88
-
89
-
90
-
91
-
92
-
93
-
94
-
95
-
96
-
97
-
98
-
99
-
100
-
101
-
102
-
103
-
104
-
105
-
106
-
107
-
108
-
109
-
110
-
111
-
112
-
113
-
114
-
115
-
116
-
117
-
118
-
119
-
120
-
121
-
122
-
123
-
124
-
125
-
126
-
127
-
128
-
129
-
130
-
131
-
132
-
133
-
134
-
135
-
136
-
137
-
138
-
139
-
140
-
141
-
142
-
143
-
144
-
145
-
146
-
147
-
148
-
149
-
150
-
151
-
152
-
153
-
154
-
155
-
156
-
157
-
158
-
159
-
160
-
161
-
162
-
163
-
164
-
165
-
166
-
167
-
168
-
169
-
170
-
171
-
172
-
173
-
174
-
175
-
176
-
177
-
178
-
179
-
180
-
181
-
182
-
183
-
184
-
185
-
186
-
187
-
188
-
189
-
190
-
191
-
192
-
193
-
194
-
195
-
196
-
197
-
198
-
199
-
200
-
201
-
202
-
203
-
204
-
205
-
206
-
207
-
208
-
209
-
210
-
211
-
212
-
213
-
214
-
215
-
216
-
217
-
218
-
219
-
220
-
221
-
222
-
223
-
224
-
225
-
226
-
227
-
228
-
229
-
230
-
231
-
232
-
233
-
234
-
235
-
236
-
237
-
238
-
239
-
240
-
241
-
242
-
243
-
244
-
245
-
246
-
247
-
248
-
249
-
250
-
251
-
252
-
253
-
254
-
255
-
256
-
257
-
258
-
259
-
260
-
261
-
262
-
263
-
264
-
265
-
266
-
267
-
268
-
269
-
270
-
271
-
272
-
273
-
274
-
275
-
276
-
277
-
278
-
279
-
280
-
281
-
282
-
283
-
284
 |
 |

62 Bank of America 2013
Federal banking regulators, in connection with the Supervisory
Capital Assessment Program in 2009, introduced an additional
measure of capital, Tier 1 common capital. Tier 1 common capital
is not an official regulatory ratio and is defined as Tier 1 capital
less preferred stock, trust preferred securities (Trust Securities),
hybrid securities and qualifying noncontrolling interest in
subsidiaries.
Risk-weighted assets are calculated for credit risk for all on-
and off-balance sheet credit exposures and for market risk on
trading assets and liabilities, including derivative exposures. Credit
risk-weighted assets are calculated by assigning a prescribed risk-
weight to all on-balance sheet assets and to the credit equivalent
amount of certain off-balance sheet exposures. The risk-weight is
defined in the regulatory rules based upon the obligor or guarantor
type and collateral, if applicable. Off-balance sheet exposures
include financial guarantees, unfunded lending commitments,
letters of credit and derivatives. Market risk-weighted assets are
calculated using risk models for trading account positions,
including all foreign exchange and commodity positions regardless
of the applicable accounting guidance. Any assets that are a direct
deduction from the computation of capital are excluded from risk-
weighted assets and adjusted average total assets consistent with
regulatory guidance. Under Basel 1, there are no risk-weighted
assets calculated for operational risk.
The Federal Reserve requires BHCs to submit a capital plan
and requests for capital actions on an annual basis, consistent
with the rules governing the Comprehensive Capital Analysis and
Review (CCAR). The CCAR is the central element of the Federal
Reserve’s approach to ensure that large BHCs have adequate
capital and robust processes for managing their capital. In January
2013, we submitted our 2013 capital plan, and received results
on March 14, 2013. The Federal Reserve’s stress scenario
projections for the Corporation, based on the 2013 capital plan,
estimated a minimum Tier 1 common capital ratio under the Basel
1 – 2013 Rules of 6.0 percent under severe adverse economic
conditions with all proposed capital actions through the end of
2014, exceeding the five percent reference rate for all institutions
involved in the CCAR. The capital plan submitted by the Corporation
included a request to repurchase up to $5.0 billion of common
stock and redeem $5.5 billion in preferred stock over four quarters
beginning in the second quarter of 2013, and continue the
quarterly common stock dividend at $0.01 per share. As of
December 31, 2013, in connection with the 2013 CCAR capital
plan, we have repurchased and retired approximately 231.7 million
common shares for an aggregate purchase price of approximately
$3.2 billion and we redeemed $5.5 billion of preferred stock
consisting of Series H and 8. As of December 31, 2013, under
the capital plan, we can purchase up to $1.8 billion of additional
common stock through the first quarter of 2014.
The timing and amount of common stock repurchases through
March 31, 2014 have been and will continue to be consistent with
the Corporation’s 2013 capital plan and will be subject to various
factors, including the Corporation’s capital position, liquidity,
applicable legal considerations, financial performance and
alternative uses of capital, stock trading price, and general market
conditions, and may be suspended at any time. The remaining
common stock repurchases may be effected through open market
purchases or privately negotiated transactions, including
repurchase plans that satisfy the conditions of Rule 10b5-1 of the
Securities Exchange Act of 1934.
In January 2014, we submitted our 2014 CCAR plan and related
supervisory stress tests. The Federal Reserve has announced that
it will release summary results, including supervisory projections
of capital ratios, losses and revenues under stress scenarios, and
publish the results of stress tests conducted under the supervisory
adverse scenario in March 2014.
For more information on these and other regulatory
requirements, see Note 16 – Regulatory Requirements and
Restrictions to the Consolidated Financial Statements.
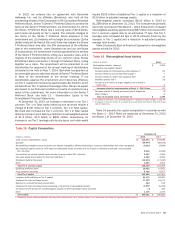
Capital Composition and Ratios
Table 14 presents Bank of America Corporation’s capital ratios
and related information in accordance with the Basel 1 – 2013
Rules as measured at December 31, 2013 and Basel 1 at
December 31, 2012.
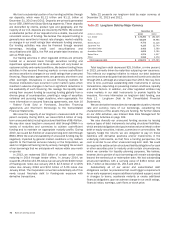
Table 14 Bank of America Corporation Regulatory
Capital – Actual and Pro-Forma
December 31
(Dollars in billions) 2013 2012
Tier 1 common capital ratio 11.19% 11.06%
Tier 1 common capital ratio (pro forma) (1) n/a 10.38
Tier 1 capital ratio 12.44 12.89
Total capital ratio 15.44 16.31
Tier 1 leverage ratio 7.86 7.37
Risk-weighted assets $ 1,298 $ 1,206
Adjusted quarterly average total assets (2) 2,053 2,111
(1) Pro-forma Tier 1 common capital ratio at December 31, 2012 includes the estimated impact
of the Basel 1 – 2013 Rules. Represents a non-GAAP financial measure. On a pro-forma basis,
risk-weighted assets would have been approximately $1,285 billion with the inclusion of $78.8
billion in pro-forma risk-weighted assets.
(2) Reflects adjusted average total assets for the three months ended December 31, 2013 and
2012.
n/a = not applicable
Tier 1 common capital under the Basel 1 – 2013 Rules was
$145.2 billion at December 31, 2013, an increase of $11.8 billion
under Basel 1 at December 31, 2012. The increase was due to
earnings eligible to be included in capital, partially offset by the
impact of the common stock repurchases. At December 31, 2012,
pro-forma Tier 1 common capital of $133.4 billion would have been
unchanged, assuming the Basel 1 – 2013 Rules had been in effect
at that time. During 2013, total capital increased $3.6 billion to
$200.3 billion primarily driven by the increase in Tier 1 common
capital and the portion of the allowance for loan and lease losses
eligible to be included in capital, partially offset by decreases in
qualifying preferred stock, qualifying subordinated debt and Trust
Securities. For additional information, see Tables 14 and 16.