Bank of America 2013 Annual Report Download - page 276
Download and view the complete annual report
Please find page 276 of the 2013 Bank of America annual report below. You can navigate through the pages in the report by either clicking on the pages listed below, or by using the keyword search tool below to find specific information within the annual report.-
 1
1 -
2
-
3
-
4
-
5
-
6
-
7
-
8
-
9
-
10
-
11
-
12
-
13
-
14
-
15
-
16
-
17
-
18
-
19
-
20
-
21
-
22
-
23
-
24
-
25
-
26
-
27
-
28
-
29
-
30
-
31
-
32
-
33
-
34
-
35
-
36
-
37
-
38
-
39
-
40
-
41
-
42
-
43
-
44
-
45
-
46
-
47
-
48
-
49
-
50
-
51
-
52
-
53
-
54
-
55
-
56
-
57
-
58
-
59
-
60
-
61
-
62
-
63
-
64
-
65
-
66
-
67
-
68
-
69
-
70
-
71
-
72
-
73
-
74
-
75
-
76
-
77
-
78
-
79
-
80
-
81
-
82
-
83
-
84
-
85
-
86
-
87
-
88
-
89
-
90
-
91
-
92
-
93
-
94
-
95
-
96
-
97
-
98
-
99
-
100
-
101
-
102
-
103
-
104
-
105
-
106
-
107
-
108
-
109
-
110
-
111
-
112
-
113
-
114
-
115
-
116
-
117
-
118
-
119
-
120
-
121
-
122
-
123
-
124
-
125
-
126
-
127
-
128
-
129
-
130
-
131
-
132
-
133
-
134
-
135
-
136
-
137
-
138
-
139
-
140
-
141
-
142
-
143
-
144
-
145
-
146
-
147
-
148
-
149
-
150
-
151
-
152
-
153
-
154
-
155
-
156
-
157
-
158
-
159
-
160
-
161
-
162
-
163
-
164
-
165
-
166
-
167
-
168
-
169
-
170
-
171
-
172
-
173
-
174
-
175
-
176
-
177
-
178
-
179
-
180
-
181
-
182
-
183
-
184
-
185
-
186
-
187
-
188
-
189
-
190
-
191
-
192
-
193
-
194
-
195
-
196
-
197
-
198
-
199
-
200
-
201
-
202
-
203
-
204
-
205
-
206
-
207
-
208
-
209
-
210
-
211
-
212
-
213
-
214
-
215
-
216
-
217
-
218
-
219
-
220
-
221
-
222
-
223
-
224
-
225
-
226
-
227
-
228
-
229
-
230
-
231
-
232
-
233
-
234
-
235
-
236
-
237
-
238
-
239
-
240
-
241
-
242
-
243
-
244
-
245
-
246
-
247
-
248
-
249
-
250
-
251
-
252
-
253
-
254
-
255
-
256
-
257
-
258
-
259
-
260
-
261
-
262
-
263
-
264
-
265
-
 266
266 -
 267
267 -
 268
268 -
 269
269 -
 270
270 -
 271
271 -
 272
272 -
 273
273 -
 274
274 -
 275
275 -
 276
276 -
 277
277 -
 278
278 -
 279
279 -
 280
280 -
 281
281 -
 282
282 -
 283
283 -
 284
284
 |
 |

274 Bank of America 2013
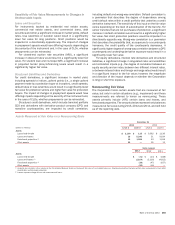
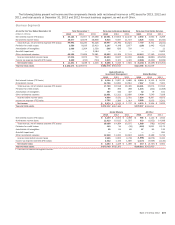
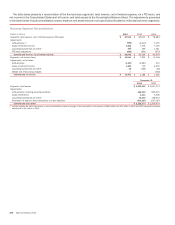
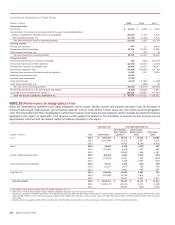
The table below presents a reconciliation of the five business segments’ total revenue, net of interest expense, on a FTE basis, and
net income to the Consolidated Statement of Income, and total assets to the Consolidated Balance Sheet. The adjustments presented
in the table below include consolidated income, expense and asset amounts not specifically allocated to individual business segments.
Business Segment Reconciliations
(Dollars in millions) 2013 2012 2011
Segments’ total revenue, net of interest expense (FTE basis) $ 87,912 $ 85,017 $ 78,384
Adjustments:
ALM activities (1) (986) (2,412) 7,576
Equity investment income 2,610 1,135 7,105
Liquidating businesses and other 265 495 1,361
FTE basis adjustment (859) (901) (972)
Consolidated revenue, net of interest expense $ 88,942 $ 83,334 $ 93,454
Segments’ net income (loss) $ 10,944 $ 7,925 $ (3,115)
Adjustments, net of taxes:
ALM activities (1,207)(4,087) 513
Equity investment income 1,644 715 4,476
Liquidating businesses and other 50 (365) (26)
Merger and restructuring charges —— (402)
Consolidated net income $ 11,431 $ 4,188 $ 1,446
December 31
2013 2012
Segments’ total assets $1,935,392 $ 1,947,174
Adjustments:
ALM activities, including securities portfolio 664,302 655,915
Equity investments 2,411 5,508
Liquidating businesses and other 70,435 138,974
Elimination of segment asset allocations to match liabilities (570,267)(537,597)
Consolidated total assets $ 2,102,273 $ 2,209,974
(1) Includes negative fair value adjustments on structured liabilities related to changes in the Corporation’s credit spreads of $649 million and $5.1 billion in 2013 and 2012 compared to positive
adjustments of $3.3 billion in 2011.