Bank of America 2013 Annual Report Download - page 118
Download and view the complete annual report
Please find page 118 of the 2013 Bank of America annual report below. You can navigate through the pages in the report by either clicking on the pages listed below, or by using the keyword search tool below to find specific information within the annual report.-
 1
1 -
2
-
3
-
4
-
5
-
6
-
7
-
8
-
9
-
10
-
11
-
12
-
13
-
14
-
15
-
16
-
17
-
18
-
19
-
20
-
21
-
22
-
23
-
24
-
25
-
26
-
27
-
28
-
29
-
30
-
31
-
32
-
33
-
34
-
35
-
36
-
37
-
38
-
39
-
40
-
41
-
42
-
43
-
44
-
45
-
46
-
47
-
48
-
49
-
50
-
51
-
52
-
53
-
54
-
55
-
56
-
57
-
58
-
59
-
60
-
61
-
62
-
63
-
64
-
65
-
66
-
67
-
68
-
69
-
70
-
71
-
72
-
73
-
74
-
75
-
76
-
77
-
78
-
79
-
80
-
81
-
82
-
83
-
84
-
85
-
86
-
87
-
88
-
89
-
90
-
91
-
92
-
93
-
94
-
95
-
96
-
97
-
98
-
99
-
100
-
101
-
102
-
103
-
104
-
105
-
106
-
107
-
 108
108 -
 109
109 -
 110
110 -
 111
111 -
 112
112 -
 113
113 -
 114
114 -
 115
115 -
 116
116 -
 117
117 -
 118
118 -
 119
119 -
 120
120 -
 121
121 -
 122
122 -
 123
123 -
 124
124 -
 125
125 -
 126
126 -
 127
127 -
 128
128 -
129
-
130
-
131
-
132
-
133
-
134
-
135
-
136
-
137
-
138
-
139
-
140
-
141
-
142
-
143
-
144
-
145
-
146
-
147
-
148
-
149
-
150
-
151
-
152
-
153
-
154
-
155
-
156
-
157
-
158
-
159
-
160
-
161
-
162
-
163
-
164
-
165
-
166
-
167
-
168
-
169
-
170
-
171
-
172
-
173
-
174
-
175
-
176
-
177
-
178
-
179
-
180
-
181
-
182
-
183
-
184
-
185
-
186
-
187
-
188
-
189
-
190
-
191
-
192
-
193
-
194
-
195
-
196
-
197
-
198
-
199
-
200
-
201
-
202
-
203
-
204
-
205
-
206
-
207
-
208
-
209
-
210
-
211
-
212
-
213
-
214
-
215
-
216
-
217
-
218
-
219
-
220
-
221
-
222
-
223
-
224
-
225
-
226
-
227
-
228
-
229
-
230
-
231
-
232
-
233
-
234
-
235
-
236
-
237
-
238
-
239
-
240
-
241
-
242
-
243
-
244
-
245
-
246
-
247
-
248
-
249
-
250
-
251
-
252
-
253
-
254
-
255
-
256
-
257
-
258
-
259
-
260
-
261
-
262
-
263
-
264
-
265
-
266
-
267
-
268
-
269
-
270
-
271
-
272
-
273
-
274
-
275
-
276
-
277
-
278
-
279
-
280
-
281
-
282
-
283
-
284
 |
 |

116 Bank of America 2013
Level 3 Assets and Liabilities
Financial assets and liabilities where values are based on
valuation techniques that require inputs that are both
unobservable and are significant to the overall fair value
measurement are classified as Level 3 under the fair value
hierarchy established in applicable accounting guidance. The Level
3 financial assets and liabilities include certain loans, MBS, ABS,
CDOs, CLOs and structured liabilities, as well as highly structured,
complex or long-dated derivative contracts, private equity
investments and consumer MSRs. The fair value of these Level 3
financial assets and liabilities is determined using pricing models,
discounted cash flow methodologies or similar techniques for
which the determination of fair value requires significant
management judgment or estimation.
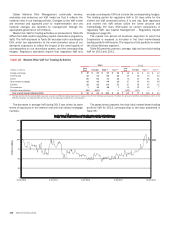
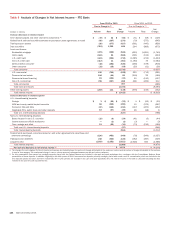
Table 71 Level 3 Asset and Liability Summary
December 31
2013 2012
(Dollars in millions)
Level 3
Fair Value
As a %
of Total
Level 3
Assets
As a %
of Total
Assets
Level 3
Fair Value
As a %
of Total
Level 3
Assets
As a %
of Total
Assets
Trading account assets $ 9,044 28.46% 0.43%$ 9,559 26.13% 0.43%
Derivative assets 7,277 22.90 0.35 8,073 22.06 0.37
AFS debt securities 4,760 14.98 0.23 5,091 13.91 0.23
All other Level 3 assets at fair value 10,697 33.66 0.50 13,865 37.90 0.63
Total Level 3 assets at fair value (1) $ 31,778 100.00% 1.51%$ 36,588 100.00% 1.66%
Level 3
Fair Value
As a %
of Total
Level 3
Liabilities
As a %
of Total
Liabilities
Level 3
Fair Value
As a %
of Total
Level 3
Liabilities
As a %
of Total
Liabilities
Derivative liabilities $ 7,301 78.20% 0.39%$ 6,605 73.51% 0.33%
Long-term debt 1,990 21.32 0.11 2,301 25.61 0.12
All other Level 3 liabilities at fair value 45 0.48 —79 0.88 0.01
Total Level 3 liabilities at fair value (1) $ 9,336 100.00% 0.50%$ 8,985 100.00% 0.46%
(1) Level 3 total assets and liabilities are shown before the impact of cash collateral and counterparty netting related to our derivative positions.
During 2013, we recognized net gains of $2.0 billion on Level
3 assets and liabilities. The net gains were primarily gains on
MSRs and trading account assets, partially offset by losses on
net derivative assets and other assets. Gains on MSRs were
primarily due to the impact of the increase in interest rates on
forecasted prepayments. Gains on trading account assets were
primarily due to realized gains on the sale of corporate bonds as
well as distributions received on secondary loan positions held in
inventory, partially offset by unrealized losses on certain
collateralized loan and debt obligations. Losses on net derivative
assets were driven by unrealized losses associated with certain
structured products and credit default and total return swaps,
partially offset by unrealized gains associated with the
performance of various index option contracts as well as gains on
IRLCs. Losses on other assets were primarily due to a write-down
of a receivable. There were net unrealized gains of $40 million
(pre-tax) in accumulated OCI on Level 3 assets and liabilities at
December 31, 2013. For more information on the components of
net realized and unrealized gains and losses during 2013, see
Note 20 – Fair Value Measurements to the Consolidated Financial
Statements.
Level 3 financial instruments, such as our consumer MSRs,
may be hedged with derivatives classified as Level 1 or 2; therefore,
gains or losses associated with Level 3 financial instruments may
be offset by gains or losses associated with financial instruments
classified in other levels of the fair value hierarchy. The Level 3
gains and losses recorded in earnings did not have a significant
impact on our liquidity or capital resources.
We conduct a review of our fair value hierarchy classifications
on a quarterly basis. Transfers into or out of Level 3 are made if
the significant inputs used in the financial models measuring the
fair values of the assets and liabilities became unobservable or
observable, respectively, in the current marketplace. These
transfers are considered to be effective as of the beginning of the
quarter in which they occur. For more information on the significant
transfers into and out of Level 3 during 2013, see Note 20 – Fair
Value Measurements to the Consolidated Financial Statements.
Accrued Income Taxes and Deferred Tax Assets
Accrued income taxes, reported as a component of accrued
expenses and other liabilities on the Consolidated Balance Sheet,
represent the net amount of current income taxes we expect to
pay to or receive from various taxing jurisdictions attributable to
our operations to date. We currently file income tax returns in more
than 100 jurisdictions and consider many factors, including
statutory, judicial and regulatory guidance, in estimating the
appropriate accrued income taxes for each jurisdiction.
Consistent with the applicable accounting guidance, we monitor
relevant tax authorities and change our estimate of accrued
income taxes due to changes in income tax laws and their
interpretation by the courts and regulatory authorities. These
revisions of our estimate of accrued income taxes, which also may
result from our income tax planning and from the resolution of
income tax controversies, may be material to our operating results
for any given period.
Net deferred tax assets, reported as a component of other
assets on the Consolidated Balance Sheet, represent the net
decrease in taxes expected to be paid in the future because of
net operating loss (NOL) and tax credit carryforwards and because
of future reversals of temporary differences in the bases of assets
and liabilities as measured by tax laws and their bases as reported
in the financial statements. NOL and tax credit carryforwards result
in reductions to future tax liabilities, and many of these attributes
can expire if not utilized within certain periods. We consider the