Bank of America 2013 Annual Report Download - page 272
Download and view the complete annual report
Please find page 272 of the 2013 Bank of America annual report below. You can navigate through the pages in the report by either clicking on the pages listed below, or by using the keyword search tool below to find specific information within the annual report.-
 1
1 -
2
-
3
-
4
-
5
-
6
-
7
-
8
-
9
-
10
-
11
-
12
-
13
-
14
-
15
-
16
-
17
-
18
-
19
-
20
-
21
-
22
-
23
-
24
-
25
-
26
-
27
-
28
-
29
-
30
-
31
-
32
-
33
-
34
-
35
-
36
-
37
-
38
-
39
-
40
-
41
-
42
-
43
-
44
-
45
-
46
-
47
-
48
-
49
-
50
-
51
-
52
-
53
-
54
-
55
-
56
-
57
-
58
-
59
-
60
-
61
-
62
-
63
-
64
-
65
-
66
-
67
-
68
-
69
-
70
-
71
-
72
-
73
-
74
-
75
-
76
-
77
-
78
-
79
-
80
-
81
-
82
-
83
-
84
-
85
-
86
-
87
-
88
-
89
-
90
-
91
-
92
-
93
-
94
-
95
-
96
-
97
-
98
-
99
-
100
-
101
-
102
-
103
-
104
-
105
-
106
-
107
-
108
-
109
-
110
-
111
-
112
-
113
-
114
-
115
-
116
-
117
-
118
-
119
-
120
-
121
-
122
-
123
-
124
-
125
-
126
-
127
-
128
-
129
-
130
-
131
-
132
-
133
-
134
-
135
-
136
-
137
-
138
-
139
-
140
-
141
-
142
-
143
-
144
-
145
-
146
-
147
-
148
-
149
-
150
-
151
-
152
-
153
-
154
-
155
-
156
-
157
-
158
-
159
-
160
-
161
-
162
-
163
-
164
-
165
-
166
-
167
-
168
-
169
-
170
-
171
-
172
-
173
-
174
-
175
-
176
-
177
-
178
-
179
-
180
-
181
-
182
-
183
-
184
-
185
-
186
-
187
-
188
-
189
-
190
-
191
-
192
-
193
-
194
-
195
-
196
-
197
-
198
-
199
-
200
-
201
-
202
-
203
-
204
-
205
-
206
-
207
-
208
-
209
-
210
-
211
-
212
-
213
-
214
-
215
-
216
-
217
-
218
-
219
-
220
-
221
-
222
-
223
-
224
-
225
-
226
-
227
-
228
-
229
-
230
-
231
-
232
-
233
-
234
-
235
-
236
-
237
-
238
-
239
-
240
-
241
-
242
-
243
-
244
-
245
-
246
-
247
-
248
-
249
-
250
-
251
-
252
-
253
-
254
-
255
-
256
-
257
-
258
-
259
-
260
-
261
-
 262
262 -
 263
263 -
 264
264 -
 265
265 -
 266
266 -
 267
267 -
 268
268 -
 269
269 -
 270
270 -
 271
271 -
 272
272 -
 273
273 -
 274
274 -
 275
275 -
 276
276 -
 277
277 -
 278
278 -
 279
279 -
 280
280 -
 281
281 -
 282
282 -
283
-
284
 |
 |

270 Bank of America 2013
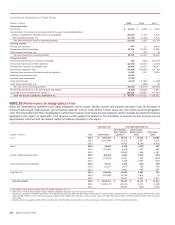
NOTE 23 Mortgage Servicing Rights
The Corporation accounts for consumer MSRs at fair value with
changes in fair value recorded in mortgage banking income (loss)
in the Consolidated Statement of Income. The Corporation
manages the risk in these MSRs with securities including MBS
and U.S. Treasuries, as well as certain derivatives such as options
and interest rate swaps, which are not designated as accounting
hedges. The securities used to manage the risk in the MSRs are
classified in other assets with changes in the fair value of the
securities and the related interest income recorded in mortgage
banking income (loss).
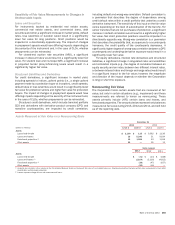
The table below presents activity for residential mortgage and
home equity MSRs for 2013 and 2012. Commercial and
residential reverse MSRs, which are carried at the lower of cost
or market value and accounted for using the amortization method,
totaled $10 million and $135 million at December 31, 2013 and
2012, and are not included in the tables in this Note.
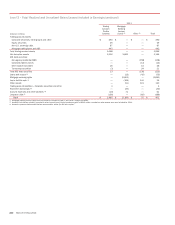
Rollforward of Mortgage Servicing Rights
(Dollars in millions) 2013 2012
Balance, January 1 $ 5,716 $ 7,378
Additions 472 374
Sales (2,044) (122)
Amortization of expected cash flows (1) (1,043) (1,484)
Impact of changes in interest rates and other market
factors (2) 1,524 (867)
Model and other cash flow assumption changes: (3)
Projected cash flows, primarily due to (increases)
decreases in costs to service loans (27) 443
Impact of changes in the Home Price Index (398) (112)
Impact of changes to the prepayment model 609 435
Other model changes (4) 233 (329)
Balance, December 31 $ 5,042 $ 5,716
Mortgage loans serviced for investors (in billions) $ 550 $ 1,045
(1) Represents the net change in fair value of the MSR asset due to the recognition of modeled
cash flows.
(2) These amounts reflect the changes in modeled MSR fair value primarily due to observed changes
in interest rates, volatility, spreads and the shape of the forward swap curve.
(3) These amounts reflect periodic adjustments to the valuation model to reflect changes in the
modeled relationship between inputs and their impact on projected cash flows as well as
changes in certain cash flow assumptions such as cost to service and ancillary income per
loan.
(4) These amounts include the impact of periodic recalibrations of the model to reflect changes in
the relationship between market interest rate spreads and projected cash flows. Also included
is a decrease of $497 million for 2012 due to changes in OAS rate inputs.
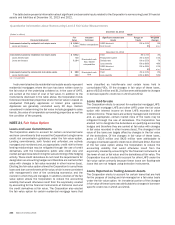
The Corporation primarily uses an OAS valuation approach
which factors in prepayment risk to determine the fair value of
MSRs. This approach consists of projecting servicing cash flows
under multiple interest rate scenarios and discounting these cash
flows using risk-adjusted discount rates. In addition to updating
the valuation model for interest, discount and prepayment rates,
periodic adjustments are made to recalibrate the valuation model
for factors used to project cash flows. The changes to the factors
capture the effect of variances related to actual versus estimated
servicing proceeds.
The $2.0 billion of MSR sales during 2013 primarily relate to
transfers completed under definitive agreements the Corporation
entered into during the year to sell certain MSRs. The transfers
of the MSRs occurred in stages throughout 2013, and all of the
servicing encompassed by these agreements had been
transferred as of December 31, 2013.
Significant economic assumptions in estimating the fair value
of MSRs at December 31, 2013 and 2012 are presented below.
The change in fair value as a result of changes in OAS rates is
included within “Model and other cash flow assumption changes”
in the Rollforward of Mortgage Servicing Rights table. The weighted-
average life is not an input in the valuation model but is a product
of both changes in market rates of interest and changes in model
and other cash flow assumptions. The weighted-average life
represents the average period of time that the MSRs’ cash flows
are expected to be received. Absent other changes, an increase
(decrease) to the weighted-average life would generally result in
an increase (decrease) in the fair value of the MSRs.
Significant Economic Assumptions
December 31
2013 2012
Fixed Adjustable Fixed Adjustable
Weighted-average OAS 3.97% 7.61% 4.00% 6.63%
Weighted-average life, in years 5.70 2.86 3.65 2.10
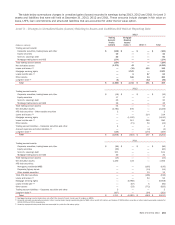
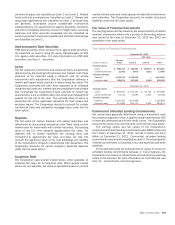
The table below presents the sensitivity of the weighted-
average lives and fair value of MSRs to changes in modeled
assumptions. These sensitivities are hypothetical and should be
used with caution. As the amounts indicate, changes in fair value
based on variations in assumptions generally cannot be
extrapolated because the relationship of the change in assumption
to the change in fair value may not be linear. Also, the effect of a
variation in a particular assumption on the fair value of MSRs that
continue to be held by the Corporation is calculated without
changing any other assumption. In reality, changes in one factor
may result in changes in another, which might magnify or counteract
the sensitivities. The below sensitivities do not reflect any hedge
strategies that may be undertaken to mitigate such risk.
Sensitivity Impacts
December 31, 2013
Change in
Weighted-average Lives
(Dollars in millions) Fixed Adjustable
Change in
Fair Value
Prepayment rates
Impact of 10% decrease 0.24 years 0.20 years $ 266
Impact of 20% decrease 0.51 0.42 558
Impact of 10% increase (0.22) (0.17) (244)
Impact of 20% increase (0.42) (0.32) (469)
OAS level
Impact of 100 bps decrease $ 268
Impact of 200 bps decrease 561
Impact of 100 bps increase (247)
Impact of 200 bps increase (474)