Bank of America 2013 Annual Report Download - page 24
Download and view the complete annual report
Please find page 24 of the 2013 Bank of America annual report below. You can navigate through the pages in the report by either clicking on the pages listed below, or by using the keyword search tool below to find specific information within the annual report.-
 1
1 -
2
-
3
-
4
-
5
-
6
-
7
-
8
-
9
-
10
-
11
-
12
-
13
-
 14
14 -
 15
15 -
 16
16 -
 17
17 -
 18
18 -
 19
19 -
 20
20 -
 21
21 -
 22
22 -
 23
23 -
 24
24 -
 25
25 -
 26
26 -
 27
27 -
 28
28 -
 29
29 -
 30
30 -
 31
31 -
 32
32 -
 33
33 -
 34
34 -
35
-
36
-
37
-
38
-
39
-
40
-
41
-
42
-
43
-
44
-
45
-
46
-
47
-
48
-
49
-
50
-
51
-
52
-
53
-
54
-
55
-
56
-
57
-
58
-
59
-
60
-
61
-
62
-
63
-
64
-
65
-
66
-
67
-
68
-
69
-
70
-
71
-
72
-
73
-
74
-
75
-
76
-
77
-
78
-
79
-
80
-
81
-
82
-
83
-
84
-
85
-
86
-
87
-
88
-
89
-
90
-
91
-
92
-
93
-
94
-
95
-
96
-
97
-
98
-
99
-
100
-
101
-
102
-
103
-
104
-
105
-
106
-
107
-
108
-
109
-
110
-
111
-
112
-
113
-
114
-
115
-
116
-
117
-
118
-
119
-
120
-
121
-
122
-
123
-
124
-
125
-
126
-
127
-
128
-
129
-
130
-
131
-
132
-
133
-
134
-
135
-
136
-
137
-
138
-
139
-
140
-
141
-
142
-
143
-
144
-
145
-
146
-
147
-
148
-
149
-
150
-
151
-
152
-
153
-
154
-
155
-
156
-
157
-
158
-
159
-
160
-
161
-
162
-
163
-
164
-
165
-
166
-
167
-
168
-
169
-
170
-
171
-
172
-
173
-
174
-
175
-
176
-
177
-
178
-
179
-
180
-
181
-
182
-
183
-
184
-
185
-
186
-
187
-
188
-
189
-
190
-
191
-
192
-
193
-
194
-
195
-
196
-
197
-
198
-
199
-
200
-
201
-
202
-
203
-
204
-
205
-
206
-
207
-
208
-
209
-
210
-
211
-
212
-
213
-
214
-
215
-
216
-
217
-
218
-
219
-
220
-
221
-
222
-
223
-
224
-
225
-
226
-
227
-
228
-
229
-
230
-
231
-
232
-
233
-
234
-
235
-
236
-
237
-
238
-
239
-
240
-
241
-
242
-
243
-
244
-
245
-
246
-
247
-
248
-
249
-
250
-
251
-
252
-
253
-
254
-
255
-
256
-
257
-
258
-
259
-
260
-
261
-
262
-
263
-
264
-
265
-
266
-
267
-
268
-
269
-
270
-
271
-
272
-
273
-
274
-
275
-
276
-
277
-
278
-
279
-
280
-
281
-
282
-
283
-
284
 |
 |

22 Bank of America 2013
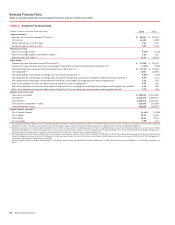
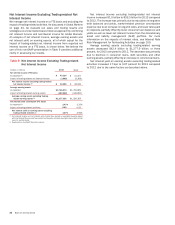
Selected Financial Data
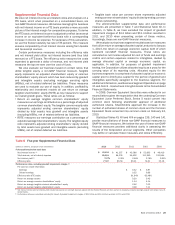
Table 1 provides selected consolidated financial data for 2013 and 2012.
Table 1 Selected Financial Data
(Dollars in millions, except per share information) 2013 2012
Income statement
Revenue, net of interest expense (FTE basis) (1) $89,801 $ 84,235
Net income 11,431 4,188
Diluted earnings per common share 0.90 0.25
Dividends paid per common share 0.04 0.04
Performance ratios
Return on average assets 0.53%0.19%
Return on average tangible shareholders’ equity (1) 7.13 2.60
Efficiency ratio (FTE basis) (1) 77.07 85.59
Asset quality
Allowance for loan and lease losses at December 31 $17,428 $ 24,179
Allowance for loan and lease losses as a percentage of total loans and leases outstanding at December 31 (2) 1.90%2.69%
Nonperforming loans, leases and foreclosed properties at December 31 (2) $17,772 $ 23,555
Net charge-offs (3) 7,897 14,908
Net charge-offs as a percentage of average loans and leases outstanding (2, 3) 0.87%1.67%
Net charge-offs as a percentage of average loans and leases outstanding, excluding the purchased credit-impaired loan portfolio (2) 0.90 1.73
Net charge-offs and purchased credit-impaired write-offs as a percentage of average loans and leases outstanding (2) 1.13 1.99
Ratio of the allowance for loan and lease losses at December 31 to net charge-offs (3) 2.21 1.62
Ratio of the allowance for loan and lease losses at December 31 to net charge-offs, excluding the purchased credit-impaired loan portfolio 1.89 1.25
Ratio of the allowance for loan and lease losses at December 31 to net charge-offs and purchased credit-impaired write-offs 1.70 1.36
Balance sheet at year end
Total loans and leases $ 928,233 $ 907,819
Total assets 2,102,273 2,209,974
Total deposits 1,119,271 1,105,261
Total common shareholders’ equity 219,333 218,188
Total shareholders’ equity 232,685 236,956
Capital ratios at year end (4)
Tier 1 common capital 11.19% 11.06%
Tier 1 capital 12.44 12.89
Total capital 15.44 16.31
Tier 1 leverage 7.86 7.37
(1) Fully taxable-equivalent (FTE) basis, return on average tangible shareholders’ equity and the efficiency ratio are non-GAAP financial measures. Other companies may define or calculate these measures
differently. For more information, see Supplemental Financial Data on page 29, and for corresponding reconciliations to GAAP financial measures, see Statistical Table XV.
(2) Balances and ratios do not include loans accounted for under the fair value option. For additional exclusions from nonperforming loans, leases and foreclosed properties, see Consumer Portfolio
Credit Risk Management – Nonperforming Consumer Loans, Leases and Foreclosed Properties Activity on page 85 and corresponding Table 41, and Commercial Portfolio Credit Risk Management –
Nonperforming Commercial Loans, Leases and Foreclosed Properties Activity on page 92 and corresponding Table 50.
(3) Net charge-offs exclude $2.3 billion of write-offs in the purchased credit-impaired loan portfolio for 2013 compared to $2.8 billion for 2012. These write-offs decreased the purchased credit-impaired
valuation allowance included as part of the allowance for loan and lease losses. For more information on purchased credit-impaired write-offs, see Consumer Portfolio Credit Risk Management –
Purchased Credit-impaired Loan Portfolio on page 81.
(4) Presents capital ratios in accordance with the Basel 1 – 2013 Rules, which include the Market Risk Final Rule at December 31, 2013. Basel 1 did not include the Basel 1 – 2013 Rules at December 31,
2012.