Bank of America 2013 Annual Report Download - page 75
Download and view the complete annual report
Please find page 75 of the 2013 Bank of America annual report below. You can navigate through the pages in the report by either clicking on the pages listed below, or by using the keyword search tool below to find specific information within the annual report.-
 1
1 -
2
-
3
-
4
-
5
-
6
-
7
-
8
-
9
-
10
-
11
-
12
-
13
-
14
-
15
-
16
-
17
-
18
-
19
-
20
-
21
-
22
-
23
-
24
-
25
-
26
-
27
-
28
-
29
-
30
-
31
-
32
-
33
-
34
-
35
-
36
-
37
-
38
-
39
-
40
-
41
-
42
-
43
-
44
-
45
-
46
-
47
-
48
-
49
-
50
-
51
-
52
-
53
-
54
-
55
-
56
-
57
-
58
-
59
-
60
-
61
-
62
-
63
-
64
-
 65
65 -
 66
66 -
 67
67 -
 68
68 -
 69
69 -
 70
70 -
 71
71 -
 72
72 -
 73
73 -
 74
74 -
 75
75 -
 76
76 -
 77
77 -
 78
78 -
 79
79 -
 80
80 -
 81
81 -
 82
82 -
 83
83 -
 84
84 -
 85
85 -
86
-
87
-
88
-
89
-
90
-
91
-
92
-
93
-
94
-
95
-
96
-
97
-
98
-
99
-
100
-
101
-
102
-
103
-
104
-
105
-
106
-
107
-
108
-
109
-
110
-
111
-
112
-
113
-
114
-
115
-
116
-
117
-
118
-
119
-
120
-
121
-
122
-
123
-
124
-
125
-
126
-
127
-
128
-
129
-
130
-
131
-
132
-
133
-
134
-
135
-
136
-
137
-
138
-
139
-
140
-
141
-
142
-
143
-
144
-
145
-
146
-
147
-
148
-
149
-
150
-
151
-
152
-
153
-
154
-
155
-
156
-
157
-
158
-
159
-
160
-
161
-
162
-
163
-
164
-
165
-
166
-
167
-
168
-
169
-
170
-
171
-
172
-
173
-
174
-
175
-
176
-
177
-
178
-
179
-
180
-
181
-
182
-
183
-
184
-
185
-
186
-
187
-
188
-
189
-
190
-
191
-
192
-
193
-
194
-
195
-
196
-
197
-
198
-
199
-
200
-
201
-
202
-
203
-
204
-
205
-
206
-
207
-
208
-
209
-
210
-
211
-
212
-
213
-
214
-
215
-
216
-
217
-
218
-
219
-
220
-
221
-
222
-
223
-
224
-
225
-
226
-
227
-
228
-
229
-
230
-
231
-
232
-
233
-
234
-
235
-
236
-
237
-
238
-
239
-
240
-
241
-
242
-
243
-
244
-
245
-
246
-
247
-
248
-
249
-
250
-
251
-
252
-
253
-
254
-
255
-
256
-
257
-
258
-
259
-
260
-
261
-
262
-
263
-
264
-
265
-
266
-
267
-
268
-
269
-
270
-
271
-
272
-
273
-
274
-
275
-
276
-
277
-
278
-
279
-
280
-
281
-
282
-
283
-
284
 |
 |
Bank of America 2013 73
For more information on our credit risk management activities,
see Consumer Portfolio Credit Risk Management on page 73,
Commercial Portfolio Credit Risk Management on page 87, Non-
U.S. Portfolio on page 96, Provision for Credit Losses and
Allowance for Credit Losses both on page 100, Note 1 – Summary
of Significant Accounting Principles, Note 4 – Outstanding Loans
and Leases and Note 5 – Allowance for Credit Losses to the
Consolidated Financial Statements.
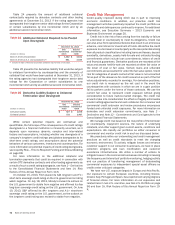
Consumer Portfolio Credit Risk Management
Credit risk management for the consumer portfolio begins with
initial underwriting and continues throughout a borrower’s credit
cycle. Statistical techniques in conjunction with experiential
judgment are used in all aspects of portfolio management
including underwriting, product pricing, risk appetite, setting credit
limits, and establishing operating processes and metrics to
quantify and balance risks and returns. Statistical models are built
using detailed behavioral information from external sources such
as credit bureaus and/or internal historical experience. These
models are a component of our consumer credit risk management
process and are used in part to assist in making both new and
ongoing credit decisions, as well as portfolio management
strategies, including authorizations and line management,
collection practices and strategies, and determination of the
allowance for loan and lease losses and allocated capital for credit
risk.
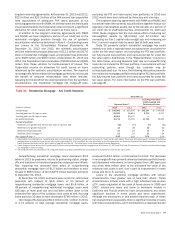
From January 2008 through 2013, Bank of America and
Countrywide have completed more than 1.3 million loan
modifications with customers. During 2013, we completed nearly
170,000 customer loan modifications with a total unpaid principal
balance of approximately $35 billion, including approximately
52,000 permanent modifications under the U.S. government’s
Making Home Affordable Program. Of the loan modifications
completed in 2013, in terms of both the volume of modifications
and the unpaid principal balance associated with the underlying
loans, most were in the portfolio serviced for investors and were
not on our balance sheet. The most common types of modifications
include a combination of rate reduction and/or capitalization of
past due amounts which represented 66 percent of the volume of
modifications completed in 2013, while principal reductions and
forgiveness represented 14 percent, principal forbearance
represented 11 percent and capitalization of past due amounts
represented six percent. For modified loans on our balance sheet,
these modification types are generally considered TDRs. For more
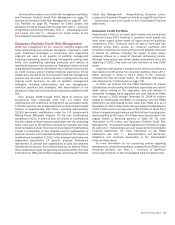
information on TDRs and portfolio impacts, see Consumer Portfolio
Credit Risk Management – Nonperforming Consumer Loans,
Leases and Foreclosed Properties Activity on page 85 and Note 4
– Outstanding Loans and Leases to the Consolidated Financial
Statements.
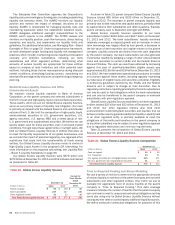
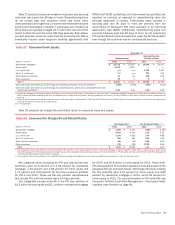
Consumer Credit Portfolio
Improvement in the U.S. economy, labor markets and home prices
continued during 2013 resulting in improved credit quality and
lower credit losses across nearly all major consumer portfolios
compared to 2012. Consumer loans 30 days or more past due
declined during 2013 across all consumer portfolios and
nonperforming consumer loans and foreclosed property continued
to decline as outflows, including the impact of loans sales,
outpaced inflows as a result of improved delinquency trends.
Although home prices have shown steady improvement since the
beginning of 2012, they have not fully recovered to their 2006
levels.
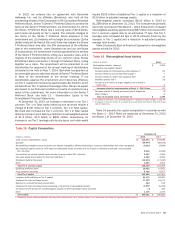
Improved credit quality, increased home prices and continued
loan balance run-off across the consumer portfolio drove a $7.7
billion decrease in 2013 to $13.4 billion in the consumer
allowance for loan and lease losses. For additional information,
see Allowance for Credit Losses on page 100.
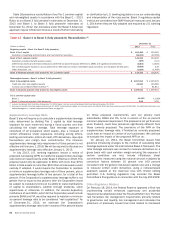
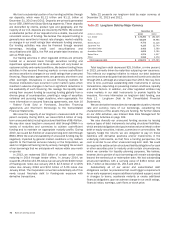
In 2013, we entered into the FNMA Settlement to resolve
substantially all outstanding and potential repurchase and certain
other claims relating to the origination, sale and delivery of
residential mortgage loans originated and sold directly to FNMA
from January 1, 2000 through December 31, 2008 by entities
related to Countrywide and BANA. In connection with the FNMA
Settlement, we repurchased certain loans from FNMA and, as of
December 31, 2013, these loans had an unpaid principal balance
of $5.7 billion and a carrying value of $4.9 billion of which $5.3
billion of unpaid principal balance and $4.6 billion of carrying value
were classified as PCI loans. All of these loans are included in the
Legacy Assets & Servicing portfolio in Table 29. For more
information on PCI loans, see Consumer Portfolio Credit Risk
Management – Purchased Credit-impaired Loan Portfolio on page
81 and Note 4 – Outstanding Loans and Leases to the Consolidated
Financial Statements. For more information on the FNMA
Settlement, see Note 7 – Representations and Warranties
Obligations and Corporate Guarantees to the Consolidated
Financial Statements.
For more information on our accounting policies regarding
delinquencies, nonperforming status, charge-offs and TDRs for the
consumer portfolio, see Note 1 – Summary of Significant
Accounting Principles to the Consolidated Financial Statements.