Bank of America 2013 Annual Report Download - page 182
Download and view the complete annual report
Please find page 182 of the 2013 Bank of America annual report below. You can navigate through the pages in the report by either clicking on the pages listed below, or by using the keyword search tool below to find specific information within the annual report.-
 1
1 -
2
-
3
-
4
-
5
-
6
-
7
-
8
-
9
-
10
-
11
-
12
-
13
-
14
-
15
-
16
-
17
-
18
-
19
-
20
-
21
-
22
-
23
-
24
-
25
-
26
-
27
-
28
-
29
-
30
-
31
-
32
-
33
-
34
-
35
-
36
-
37
-
38
-
39
-
40
-
41
-
42
-
43
-
44
-
45
-
46
-
47
-
48
-
49
-
50
-
51
-
52
-
53
-
54
-
55
-
56
-
57
-
58
-
59
-
60
-
61
-
62
-
63
-
64
-
65
-
66
-
67
-
68
-
69
-
70
-
71
-
72
-
73
-
74
-
75
-
76
-
77
-
78
-
79
-
80
-
81
-
82
-
83
-
84
-
85
-
86
-
87
-
88
-
89
-
90
-
91
-
92
-
93
-
94
-
95
-
96
-
97
-
98
-
99
-
100
-
101
-
102
-
103
-
104
-
105
-
106
-
107
-
108
-
109
-
110
-
111
-
112
-
113
-
114
-
115
-
116
-
117
-
118
-
119
-
120
-
121
-
122
-
123
-
124
-
125
-
126
-
127
-
128
-
129
-
130
-
131
-
132
-
133
-
134
-
135
-
136
-
137
-
138
-
139
-
140
-
141
-
142
-
143
-
144
-
145
-
146
-
147
-
148
-
149
-
150
-
151
-
152
-
153
-
154
-
155
-
156
-
157
-
158
-
159
-
160
-
161
-
162
-
163
-
164
-
165
-
166
-
167
-
168
-
169
-
170
-
171
-
 172
172 -
 173
173 -
 174
174 -
 175
175 -
 176
176 -
 177
177 -
 178
178 -
 179
179 -
 180
180 -
 181
181 -
 182
182 -
 183
183 -
 184
184 -
 185
185 -
 186
186 -
 187
187 -
 188
188 -
 189
189 -
 190
190 -
 191
191 -
 192
192 -
193
-
194
-
195
-
196
-
197
-
198
-
199
-
200
-
201
-
202
-
203
-
204
-
205
-
206
-
207
-
208
-
209
-
210
-
211
-
212
-
213
-
214
-
215
-
216
-
217
-
218
-
219
-
220
-
221
-
222
-
223
-
224
-
225
-
226
-
227
-
228
-
229
-
230
-
231
-
232
-
233
-
234
-
235
-
236
-
237
-
238
-
239
-
240
-
241
-
242
-
243
-
244
-
245
-
246
-
247
-
248
-
249
-
250
-
251
-
252
-
253
-
254
-
255
-
256
-
257
-
258
-
259
-
260
-
261
-
262
-
263
-
264
-
265
-
266
-
267
-
268
-
269
-
270
-
271
-
272
-
273
-
274
-
275
-
276
-
277
-
278
-
279
-
280
-
281
-
282
-
283
-
284
 |
 |

180 Bank of America 2013
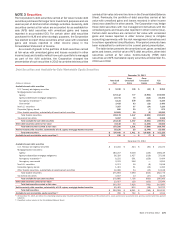
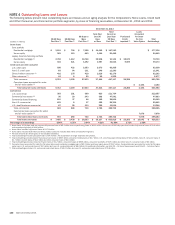
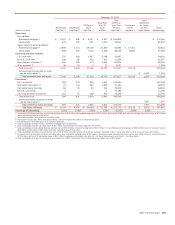
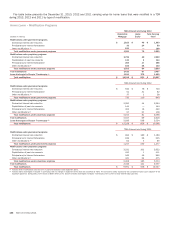
NOTE 4 Outstanding Loans and Leases
The following tables present total outstanding loans and leases and an aging analysis for the Corporation’s Home Loans, Credit Card
and Other Consumer, and Commercial portfolio segments, by class of financing receivables, at December 31, 2013 and 2012.
December 31, 2013
(Dollars in millions)
30-59 Days
Past Due (1)
60-89 Days
Past Due (1)
90 Days or
More
Past Due (2)
Total Past
Due 30
Days
or More
Total
Current or
Less Than
30 Days
Past Due (3)
Purchased
Credit-
impaired (4)
Loans
Accounted
for Under
the Fair
Value Option
Total
Outstandings
Home loans
Core portfolio
Residential mortgage $ 2,151 $ 754 $ 7,188 $ 10,093 $ 167,243 $ 177,336
Home equity 243 113 693 1,049 53,450 54,499
Legacy Assets & Servicing portfolio
Residential mortgage (5) 2,758 1,412 16,746 20,916 31,142 $ 18,672 70,730
Home equity 444 221 1,292 1,957 30,623 6,593 39,173
Credit card and other consumer
U.S. credit card 598 422 1,053 2,073 90,265 92,338
Non-U.S. credit card 63 54 131 248 11,293 11,541
Direct/Indirect consumer (6) 431 175 410 1,016 81,176 82,192
Other consumer (7) 24 8 20 52 1,925 1,977
Total consumer 6,712 3,159 27,533 37,404 467,117 25,265 529,786
Consumer loans accounted for under
the fair value option (8) $ 2,164 2,164
Total consumer loans and leases 6,712 3,159 27,533 37,404 467,117 25,265 2,164 531,950
Commercial
U.S. commercial 363 151 309 823 211,734 212,557
Commercial real estate (9) 30 29 243 302 47,591 47,893
Commercial lease financing 110 37 48 195 25,004 25,199
Non-U.S. commercial 103 8 17 128 89,334 89,462
U.S. small business commercial 87 55 113 255 13,039 13,294
Total commercial 693 280 730 1,703 386,702 388,405
Commercial loans accounted for under
the fair value option (8) 7,878 7,878
Total commercial loans and leases 693 280 730 1,703 386,702 7,878 396,283
Total loans and leases $ 7,405 $ 3,439 $ 28,263 $ 39,107 $ 853,819 $ 25,265 $ 10,042 $ 928,233
Percentage of outstandings 0.80% 0.37% 3.04% 4.21% 91.99% 2.72%1.08%
(1) Home loans 30-59 days past due includes fully-insured loans of $2.5 billion and nonperforming loans of $623 million. Home loans 60-89 days past due includes fully-insured loans of $1.2 billion
and nonperforming loans of $410 million.
(2) Home loans includes fully-insured loans of $17.0 billion.
(3) Home loans includes $5.9 billion and direct/indirect consumer includes $33 million of nonperforming loans.
(4) PCI loan amounts are shown gross of the valuation allowance.
(5) Total outstandings includes pay option loans of $4.4 billion. The Corporation no longer originates this product.
(6) Total outstandings includes dealer financial services loans of $38.5 billion, consumer lending loans of $2.7 billion, U.S. securities-based lending loans of $31.2 billion, non-U.S. consumer loans of
$4.7 billion, student loans of $4.1 billion and other consumer loans of $1.0 billion.
(7) Total outstandings includes consumer finance loans of $1.2 billion, consumer leases of $606 million, consumer overdrafts of $176 million and other non-U.S. consumer loans of $5 million.
(8) Consumer loans accounted for under the fair value option were residential mortgage loans of $2.0 billion and home equity loans of $147 million. Commercial loans accounted for under the fair value
option were U.S. commercial loans of $1.5 billion and non-U.S. commercial loans of $6.4 billion. For additional information, see Note 20 – Fair Value Measurements and Note 21 – Fair Value Option.
(9) Total outstandings includes U.S. commercial real estate loans of $46.3 billion and non-U.S. commercial real estate loans of $1.6 billion.