Bank of America 2013 Annual Report Download - page 139
Download and view the complete annual report
Please find page 139 of the 2013 Bank of America annual report below. You can navigate through the pages in the report by either clicking on the pages listed below, or by using the keyword search tool below to find specific information within the annual report.-
 1
1 -
2
-
3
-
4
-
5
-
6
-
7
-
8
-
9
-
10
-
11
-
12
-
13
-
14
-
15
-
16
-
17
-
18
-
19
-
20
-
21
-
22
-
23
-
24
-
25
-
26
-
27
-
28
-
29
-
30
-
31
-
32
-
33
-
34
-
35
-
36
-
37
-
38
-
39
-
40
-
41
-
42
-
43
-
44
-
45
-
46
-
47
-
48
-
49
-
50
-
51
-
52
-
53
-
54
-
55
-
56
-
57
-
58
-
59
-
60
-
61
-
62
-
63
-
64
-
65
-
66
-
67
-
68
-
69
-
70
-
71
-
72
-
73
-
74
-
75
-
76
-
77
-
78
-
79
-
80
-
81
-
82
-
83
-
84
-
85
-
86
-
87
-
88
-
89
-
90
-
91
-
92
-
93
-
94
-
95
-
96
-
97
-
98
-
99
-
100
-
101
-
102
-
103
-
104
-
105
-
106
-
107
-
108
-
109
-
110
-
111
-
112
-
113
-
114
-
115
-
116
-
117
-
118
-
119
-
120
-
121
-
122
-
123
-
124
-
125
-
126
-
127
-
128
-
 129
129 -
 130
130 -
 131
131 -
 132
132 -
 133
133 -
 134
134 -
 135
135 -
 136
136 -
 137
137 -
 138
138 -
 139
139 -
 140
140 -
 141
141 -
 142
142 -
 143
143 -
 144
144 -
 145
145 -
 146
146 -
 147
147 -
 148
148 -
 149
149 -
150
-
151
-
152
-
153
-
154
-
155
-
156
-
157
-
158
-
159
-
160
-
161
-
162
-
163
-
164
-
165
-
166
-
167
-
168
-
169
-
170
-
171
-
172
-
173
-
174
-
175
-
176
-
177
-
178
-
179
-
180
-
181
-
182
-
183
-
184
-
185
-
186
-
187
-
188
-
189
-
190
-
191
-
192
-
193
-
194
-
195
-
196
-
197
-
198
-
199
-
200
-
201
-
202
-
203
-
204
-
205
-
206
-
207
-
208
-
209
-
210
-
211
-
212
-
213
-
214
-
215
-
216
-
217
-
218
-
219
-
220
-
221
-
222
-
223
-
224
-
225
-
226
-
227
-
228
-
229
-
230
-
231
-
232
-
233
-
234
-
235
-
236
-
237
-
238
-
239
-
240
-
241
-
242
-
243
-
244
-
245
-
246
-
247
-
248
-
249
-
250
-
251
-
252
-
253
-
254
-
255
-
256
-
257
-
258
-
259
-
260
-
261
-
262
-
263
-
264
-
265
-
266
-
267
-
268
-
269
-
270
-
271
-
272
-
273
-
274
-
275
-
276
-
277
-
278
-
279
-
280
-
281
-
282
-
283
-
284
 |
 |

Bank of America 2013 137
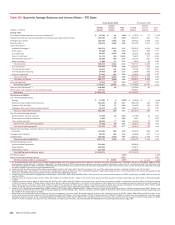
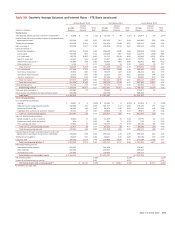
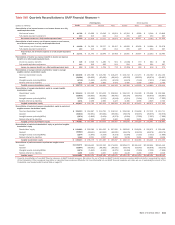
Table XIII Quarterly Average Balances and Interest Rates – FTE Basis (continued)
Second Quarter 2013 First Quarter 2013 Fourth Quarter 2012
(Dollars in millions)
Average
Balance
Interest
Income/
Expense
Yield/
Rate
Average
Balance
Interest
Income/
Expense
Yield/
Rate
Average
Balance
Interest
Income/
Expense
Yield/
Rate
Earning assets
Time deposits placed and other short-term investments (1) $ 15,088 $ 46 1.21% $ 16,129 $ 46 1.17% $ 16,967 $501.14%
Federal funds sold and securities borrowed or purchased under
agreements to resell 233,394 319 0.55 237,463 315 0.54 241,950 329 0.54
Trading account assets 181,620 1,224 2.70 194,364 1,380 2.87 186,252 1,362 2.91
Debt securities (2) 343,260 2,557 2.98 356,399 2,556 2.87 360,213 2,201 2.44
Loans and leases (3):
Residential mortgage (4) 257,275 2,246 3.49 258,630 2,340 3.62 256,564 2,292 3.57
Home equity 101,708 951 3.74 105,939 997 3.80 110,270 1,068 3.86
U.S. credit card 89,722 2,192 9.80 91,712 2,249 9.95 92,849 2,336 10.01
Non-U.S. credit card 10,613 315 11.93 11,027 329 12.10 13,081 383 11.66
Direct/Indirect consumer (5) 82,485 598 2.90 82,364 620 3.06 82,583 662 3.19
Other consumer (6) 1,756 17 4.17 1,666 19 4.36 1,602 19 4.57
Total consumer 543,559 6,319 4.66 551,338 6,554 4.79 556,949 6,760 4.84
U.S. commercial 217,464 1,741 3.21 210,706 1,666 3.20 209,496 1,729 3.28
Commercial real estate (7) 40,612 340 3.36 39,179 326 3.38 38,192 341 3.55
Commercial lease financing 23,579 205 3.48 23,534 236 4.01 22,839 184 3.23
Non-U.S. commercial 89,020 543 2.45 81,502 467 2.32 65,690 433 2.62
Total commercial 370,675 2,829 3.06 354,921 2,695 3.07 336,217 2,687 3.18
Total loans and leases 914,234 9,148 4.01 906,259 9,249 4.12 893,166 9,447 4.21
Other earning assets 81,740 713 3.50 90,172 733 3.29 90,388 771 3.40
Total earning assets (8) 1,769,336 14,007 3.17 1,800,786 14,279 3.20 1,788,936 14,160 3.16
Cash and cash equivalents (1) 104,486 40 92,846 33 111,671 42
Other assets, less allowance for loan and lease losses 310,788 318,798 309,758
Total assets $ 2,184,610 $ 2,212,430 $ 2,210,365
Interest-bearing liabilities
U.S. interest-bearing deposits:
Savings $ 44,897 $ 6 0.05% $ 42,934 $ 6 0.05% $ 41,294 $ 6 0.06%
NOW and money market deposit accounts 500,628 107 0.09 501,177 117 0.09 479,130 146 0.12
Consumer CDs and IRAs 85,001 130 0.62 88,376 138 0.63 91,256 156 0.68
Negotiable CDs, public funds and other deposits 22,721 27 0.46 20,880 26 0.52 19,904 27 0.54
Total U.S. interest-bearing deposits 653,247 270 0.17 653,367 287 0.18 631,584 335 0.21
Non-U.S. interest-bearing deposits:
Banks located in non-U.S. countries 10,832 17 0.64 12,155 19 0.64 11,970 22 0.71
Governments and official institutions 924 — 0.26 901 1 0.23 876 10.29
Time, savings and other 55,661 79 0.56 54,597 75 0.56 53,649 80 0.60
Total non-U.S. interest-bearing deposits 67,417 96 0.57 67,653 95 0.57 66,495 103 0.62
Total interest-bearing deposits 720,664 366 0.20 721,020 382 0.22 698,079 438 0.25
Federal funds purchased, securities loaned or sold under
agreements to repurchase and short-term borrowings 318,028 809 1.02 337,644 749 0.90 336,341 855 1.01
Trading account liabilities 94,349 427 1.82 92,047 472 2.08 80,084 420 2.09
Long-term debt 270,198 1,674 2.48 273,999 1,834 2.70 277,894 1,934 2.77
Total interest-bearing liabilities (8) 1,403,239 3,276 0.94 1,424,710 3,437 0.98 1,392,398 3,647 1.04
Noninterest-bearing sources:
Noninterest-bearing deposits 359,292 354,260 379,997
Other liabilities 187,016 196,465 199,458
Shareholders’ equity 235,063 236,995 238,512
Total liabilities and shareholders’ equity $ 2,184,610 $ 2,212,430 $ 2,210,365
Net interest spread 2.23% 2.22% 2.12%
Impact of noninterest-bearing sources 0.20 0.21 0.22
Net interest income/yield on earning assets (1) $ 10,731 2.43% $ 10,842 2.43% $ 10,513 2.34%
For footnotes see page 136.