Bank of America 2013 Annual Report Download - page 40
Download and view the complete annual report
Please find page 40 of the 2013 Bank of America annual report below. You can navigate through the pages in the report by either clicking on the pages listed below, or by using the keyword search tool below to find specific information within the annual report.-
 1
1 -
2
-
3
-
4
-
5
-
6
-
7
-
8
-
9
-
10
-
11
-
12
-
13
-
14
-
15
-
16
-
17
-
18
-
19
-
20
-
21
-
22
-
23
-
24
-
25
-
26
-
27
-
28
-
29
-
 30
30 -
 31
31 -
 32
32 -
 33
33 -
 34
34 -
 35
35 -
 36
36 -
 37
37 -
 38
38 -
 39
39 -
 40
40 -
 41
41 -
 42
42 -
 43
43 -
 44
44 -
 45
45 -
 46
46 -
 47
47 -
 48
48 -
 49
49 -
 50
50 -
51
-
52
-
53
-
54
-
55
-
56
-
57
-
58
-
59
-
60
-
61
-
62
-
63
-
64
-
65
-
66
-
67
-
68
-
69
-
70
-
71
-
72
-
73
-
74
-
75
-
76
-
77
-
78
-
79
-
80
-
81
-
82
-
83
-
84
-
85
-
86
-
87
-
88
-
89
-
90
-
91
-
92
-
93
-
94
-
95
-
96
-
97
-
98
-
99
-
100
-
101
-
102
-
103
-
104
-
105
-
106
-
107
-
108
-
109
-
110
-
111
-
112
-
113
-
114
-
115
-
116
-
117
-
118
-
119
-
120
-
121
-
122
-
123
-
124
-
125
-
126
-
127
-
128
-
129
-
130
-
131
-
132
-
133
-
134
-
135
-
136
-
137
-
138
-
139
-
140
-
141
-
142
-
143
-
144
-
145
-
146
-
147
-
148
-
149
-
150
-
151
-
152
-
153
-
154
-
155
-
156
-
157
-
158
-
159
-
160
-
161
-
162
-
163
-
164
-
165
-
166
-
167
-
168
-
169
-
170
-
171
-
172
-
173
-
174
-
175
-
176
-
177
-
178
-
179
-
180
-
181
-
182
-
183
-
184
-
185
-
186
-
187
-
188
-
189
-
190
-
191
-
192
-
193
-
194
-
195
-
196
-
197
-
198
-
199
-
200
-
201
-
202
-
203
-
204
-
205
-
206
-
207
-
208
-
209
-
210
-
211
-
212
-
213
-
214
-
215
-
216
-
217
-
218
-
219
-
220
-
221
-
222
-
223
-
224
-
225
-
226
-
227
-
228
-
229
-
230
-
231
-
232
-
233
-
234
-
235
-
236
-
237
-
238
-
239
-
240
-
241
-
242
-
243
-
244
-
245
-
246
-
247
-
248
-
249
-
250
-
251
-
252
-
253
-
254
-
255
-
256
-
257
-
258
-
259
-
260
-
261
-
262
-
263
-
264
-
265
-
266
-
267
-
268
-
269
-
270
-
271
-
272
-
273
-
274
-
275
-
276
-
277
-
278
-
279
-
280
-
281
-
282
-
283
-
284
 |
 |

38 Bank of America 2013
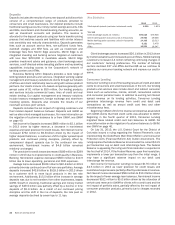
to paydowns, PCI write-offs, charge-offs and loan sales, partially
offset by the addition of loans repurchased in connection with the
FNMA Settlement. For more information on the loans repurchased
in connection with the FNMA Settlement, see Consumer Portfolio
Credit Risk Management on page 73.
Legacy Serviced Portfolio
The Legacy Serviced Portfolio includes the Legacy Owned Portfolio
and those loans serviced for outside investors that met the criteria
as described above. The table below summarizes the balances of
the residential mortgage loans included in the Legacy Serviced
Portfolio (the Legacy Residential Mortgage Serviced Portfolio)
representing 28 percent, 38 percent and 41 percent of the total
residential mortgage serviced portfolio of $719 billion, $1.2 trillion
and $1.6 trillion as measured by unpaid principal balance at
December 31, 2013, 2012 and 2011, respectively. The decline in
the Legacy Residential Mortgage Serviced Portfolio in 2013 was
primarily due to MSR sales, loan sales and other servicing
transfers, modifications, paydowns and payoffs.
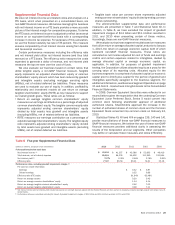
Legacy Residential Mortgage Serviced Portfolio, a subset
of the Residential Mortgage Serviced Portfolio (1, 2)
December 31
(Dollars in billions) 2013 2012 2011
Unpaid principal balance
Residential mortgage loans
Total $ 203 $ 467 $ 659
60 days or more past due 49 137 235
Number of loans serviced (in thousands)
Residential mortgage loans
Total 1,083 2,542 3,440
60 days or more past due 258 649 1,061
(1) Excludes loans for which servicing transferred to third parties as of December 31, 2013, with
an effective MSR sale date of January 2, 2014, totaling $57 million of unpaid principal balance.
(2) Excludes $39 billion, $52 billion and $84 billion of home equity loans and HELOCs at
December 31, 2013, 2012 and 2011, respectively.
Non-Legacy Portfolio
As previously discussed, Legacy Assets & Servicing is responsible
for all of our servicing activities. The table below summarizes the
balances of the residential mortgage loans that are not included
in the Legacy Serviced Portfolio (the Non-Legacy Residential
Mortgage Serviced Portfolio) representing 72 percent, 62 percent
and 59 percent of the total residential mortgage serviced portfolio,
as measured by unpaid principal balance, at December 31, 2013,
2012 and 2011, respectively. The decline in the Non-Legacy
Residential Mortgage Serviced Portfolio was primarily due to MSR
sales and other servicing transfers, paydowns and payoffs.
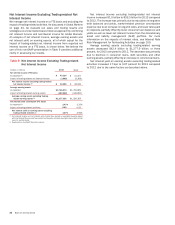
Non-Legacy Residential Mortgage Serviced Portfolio, a
subset of the Residential Mortgage Serviced Portfolio (1, 2)
December 31
(Dollars in billions) 2013 2012 2011
Unpaid principal balance
Residential mortgage loans
Total $ 516 $ 755 $ 953
60 days or more past due 12 22 17
Number of loans serviced (in thousands)
Residential mortgage loans
Total 3,267 4,764 5,731
60 days or more past due 67 124 95
(1) Excludes loans for which servicing transferred to third parties as of December 31, 2013, with
an effective MSR sale date of January 2, 2014, totaling $163 million of unpaid principal balance.
(2) Excludes $52 billion, $58 billion and $67 billion of home equity loans and HELOCs at
December 31, 2013, 2012 and 2011, respectively.
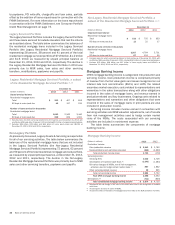
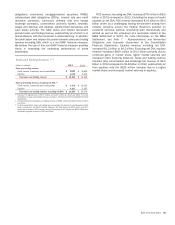
Mortgage Banking Income
CRES mortgage banking income is categorized into production and
servicing income. Core production income is comprised primarily
of revenue from the fair value gains and losses recognized on our
interest rate lock commitments (IRLCs) and LHFS, the related
secondary market execution, costs related to representations and
warranties in the sales transactions along with other obligations
incurred in the sales of mortgage loans, and revenue earned in
production-related ancillary businesses. Ongoing costs related to
representations and warranties and other obligations that were
incurred in the sales of mortgage loans in prior periods are also
included in production income.
Servicing income includes income earned in connection with
servicing activities and MSR valuation adjustments, net of results
from risk management activities used to hedge certain market
risks of the MSRs. The costs associated with our servicing
activities are included in noninterest expense.
The table below summarizes the components of mortgage
banking income.
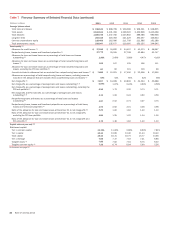
Mortgage Banking Income
(Dollars in millions) 2013 2012
Production income:
Core production revenue $ 2,543 $ 3,760
Representations and warranties provision (840) (3,939)
Total production income (loss) 1,703 (179)
Servicing income:
Servicing fees 3,030 4,729
Amortization of expected cash flows (1) (1,043) (1,484)
Fair value changes of MSRs, net of risk management
activities used to hedge certain market risks (2) 867 1,852
Other servicing-related revenue 28 635
Total net servicing income 2,882 5,732
Total CRES mortgage banking income 4,585 5,553
Eliminations (3) (711) (803)
Total consolidated mortgage banking income $ 3,874 $ 4,750
(1) Represents the net change in fair value of the MSR asset due to the recognition of modeled
cash flows.
(2) Includes gains (losses) on sales of MSRs.
(3) Includes the effect of transfers of mortgage loans from CRES to the ALM portfolio in All Other.